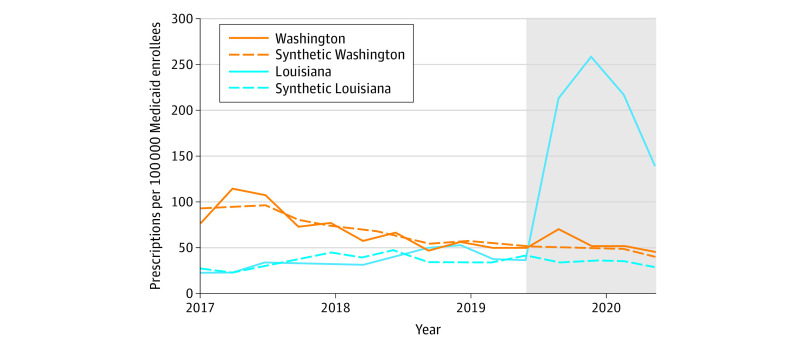
Figure 1. Trends in Hepatitis C Virus Prescription Fills in Treated States and Synthetic Controls.
This analysis is based on Medicaid State Drug Utilization Data for 2017 through 2020. The shaded section of the graph indicates the post–subscription-based payment model implementation period. Synthetic Louisiana and synthetic Washington are weighted combinations of control states that best approximated pretrends in outcomes and that had similar liver damage and sobriety restrictions. See the eMethods and eTable 3 in the Supplement for a description of the synthetic analysis.

