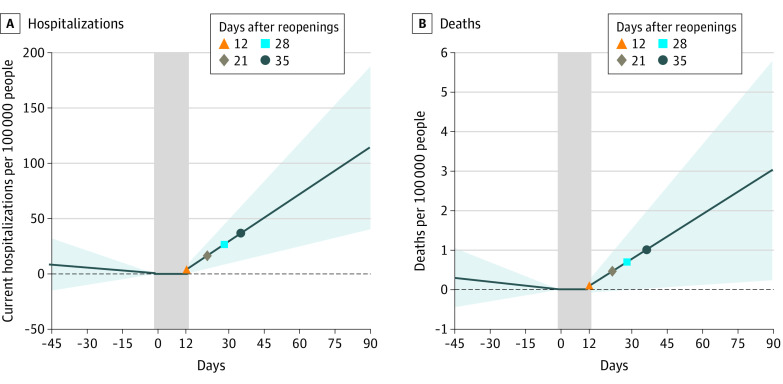
Figure 2. Interrupted Time Series Estimates of Adjusted Change in Rates of COVID-19–Related Hospitalizations and Deaths Associated With State Initial Reopenings.
Changes in hospitalizations (A) and deaths (B) relative to the day of initial reopening. The vertical gray bars capture day 0 (day of reopening) through day 12 (end of washout period). The shaded areas represent 95% CIs.

