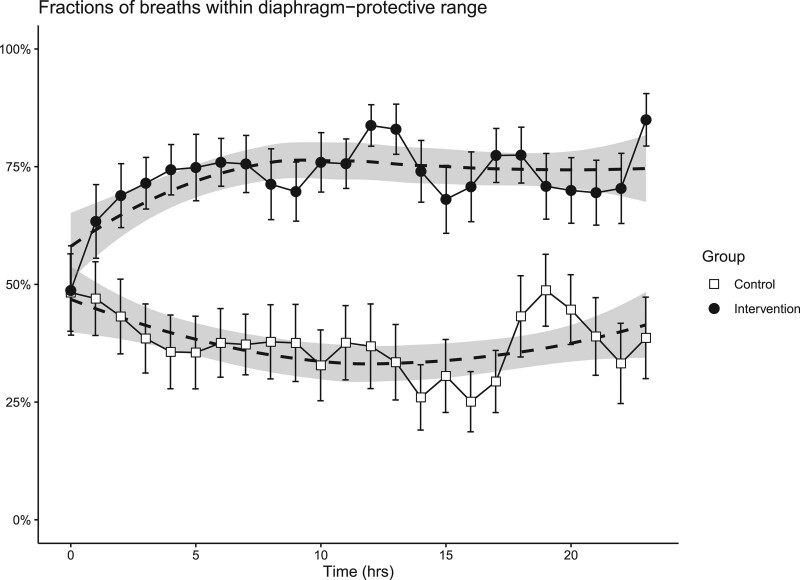
Figure 3.
Proportion of breaths in diaphragm-protective range, defined as 3–12 cm H2O per breath, in each group. Dots represent the mean; bars represent the se of the mean; asterisks represent the hours with a significant difference between the groups in the post hoc analysis. Shaded area represents the 95% CI obtained with Loess regression.

