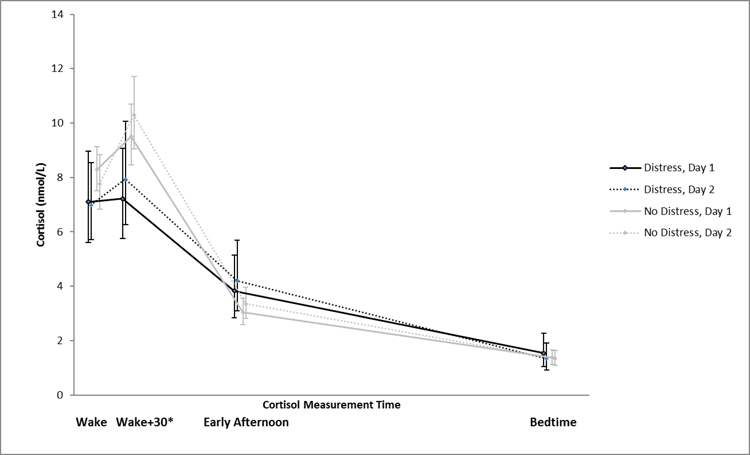
Figure 1.
Geometric Mean Salivary Cortisol Concentrations Over Time by Reported Palpitations Distress
Figure 1 shows mean daily cortisol values by palpitations distress groups at each time point on each of the two assessment days. Both groups showed the expected salivary cortisol diurnal variation (higher morning, lower evening). Compared to the no distress group, the palpitations distress group had significantly lower Wake+30 cortisol values. *p< .05

