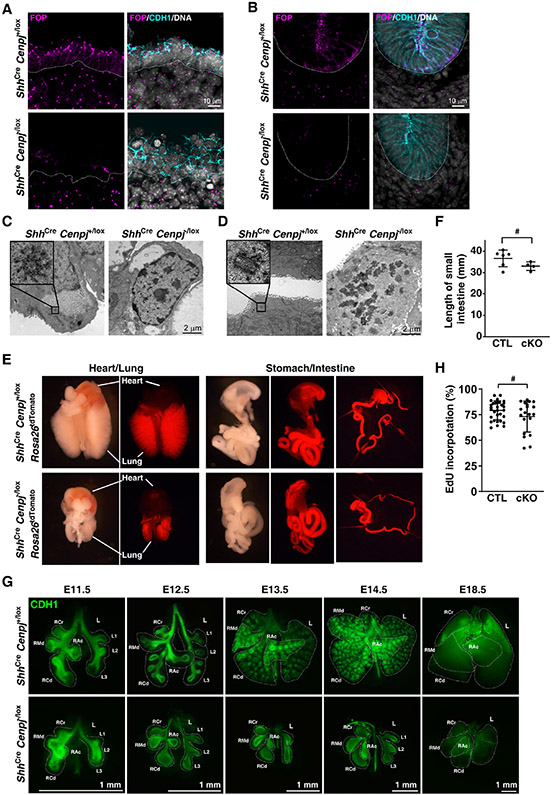
Figure 1. Endodermal centrioles are essential for lung branching, but not intestinal development.
(A, B) Immunostaining of E11.5 control (ShhCre Cenpj+/lox) and Cenpj loss of function (ShhCre Cenpj−/lox) lung (A) and small intestine (B) sections for centrioles (FOP, magenta), epithelium (CDH1, cyan) and nuclei (Hoechst, gray). Scale bar, 10 μm.
(C, D) Transmission electron microscopy of E16.5 control (ShhCre Cenpj+/lox) and Cenpj loss of function (ShhCre Cenpj−/lox) lung (A) and small intestine (B) epithelium. Other images from these serially sectioned lung cells are included in supplemental Figure S1 and Figure S2. No centrioles were detected in ShhCre Cenpj−/lox lung and intestinal epithelial cells. Scale bar, 2 μm.
(E) Gross appearance of the lung and intestine from the control (ShhCre Cenpj+/lox Rosa26tdTomato) and Cenpj loss of function (ShhCre Cenpj−/lox Rosa26tdTomato) embryos at E16.5.
(F) Statistics of the length of control (CTL, ShhCre Cenpj+/lox) and Cenpj loss of function (cKO, ShhCre Cenpj−/lox) small intestine. # denotes statical insignificance, p=0.1292, n=5 for CTL and n=4 for cKO.
(G) Wholemount immunostaining of control (ShhCre Cenpj+/lox) and Cenpj loss of function (ShhCre Cenpj−/lox) lungs for CDH1 at E11.5, E12.5, E13.5, E14.5 and E18.5. Dashed lines outline the major lobes including right cranial (RCr), right middle (RMd), right accessory (RAc), right caudal (RCd), and left (L) lobes. Scale bars, 1 mm.
(H) Measurement of EdU incorporation into replicating DNA of E12.5 control (ShhCre Cenpj+/lox) and Cenpj loss of function (ShhCre Cenpj−/lox) lung epithelium. # denotes statistical insignificance, p=0.1648. n=9, 11, 16 and 8 respectively.

