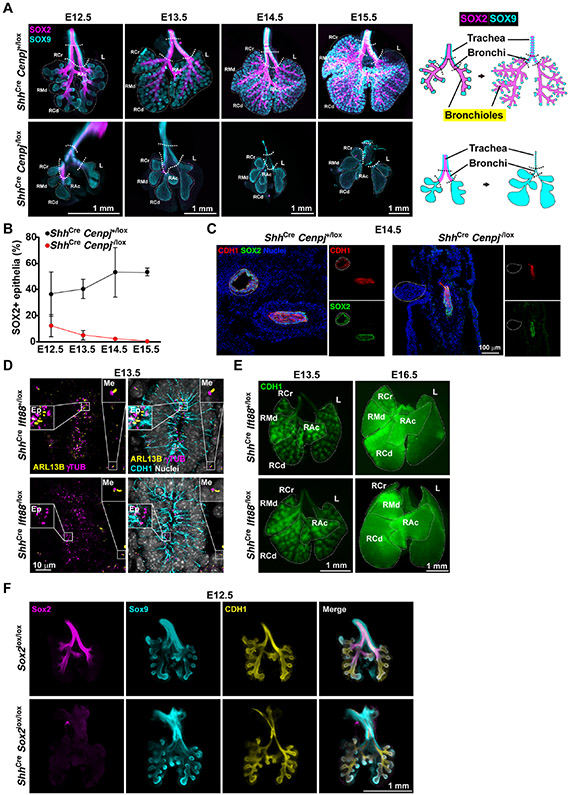
Figure 2. Centrioles are required for development of SOX2-expressing lung epithelium.
(A) Wholemount immunostaining of E12.5, E13.5, E14.5 and E15.5 control (ShhCre Cenpj+/lox) and Cenpj loss of function (ShhCre Cenpj−/lox) lungs for SOX2 (magenta), SOX9 (cyan). Schematic (right) illustrates the expression of SOX2 in the trachea, bronchi and bronchioles, and of SOX9 in the tracheal rings and distal tip progenitors of lung. Scale bars,1 mm.
(B) Quantification of the percentage of epithelium expressing SOX2. Maximum projection images of wholemount staining from (A) were analyzed. n=3.
(C) Immunostaining of CDH1 in frozen sections of E14.5 control (ShhCre Cenpj+/lox) and Cenpj loss of function (ShhCre Cenpj−/lox) lungs. Images are of section through the trachea and esophagus. White dashed lines outline the trachea. Scale bar, 100 μm.
(D) Immunostaining of E13.5 control (ShhCre Ift88+/lox) and Ift88 loss of function (ShhCre Ift88−/lox) lung sections for cilia (ARL13B, yellow), centrosomes (γTubulin, γTUB, magenta), epithelium (CDH1, cyan) and nuclei (Hoechst, gray). Scale bar, 10 μm.
(E) Wholemount immunostaining of E13.5 and E16.5 control (ShhCre Ift88+/lox) and Ift88 loss of function (ShhCre Ift88−/lox) lungs for CDH1. Dashed lines outline the major lobes. Scale bar, 1 mm.
(F) Wholemount immunostaining of E12.5 control (Sox2lox/lox) and Sox2 loss of function (ShhCre Sox2lox/lox) lungs for SOX2 (magenta), SOX9 (cyan) and epithelium (CDH1, yellow). Scale bar, 1 mm.

