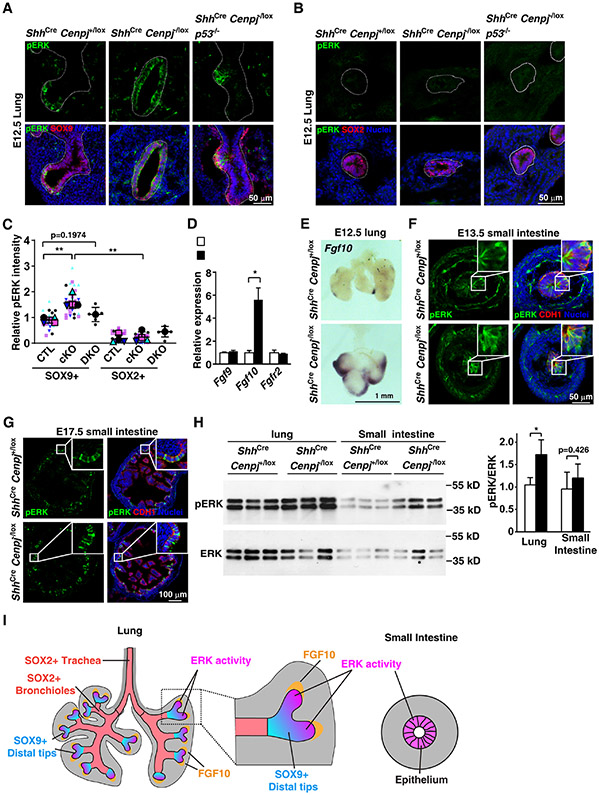
Figure 4. ERK activity correlates with survival of acentriolar cells.
(A-C) Immunostaining (A, B) and quantification (C) of phospho-ERK (pERK) in E12.5 control (ShhCre Cenpj+/lox), Cenpj loss of function (ShhCre Cenpj−/lox) and Cenpj and p53 combined loss of function (ShhCre Cenpj−/lox p53−/−) lung sections. pERK was co-stained with SOX9 (A) or SOX2 (B), respectively. Scale bar, 50 μm. Data from 4 independent experiments for control and Cenpj loss of function were analyzed in the super plot; n=6 for ShhCre Cenpj−/lox p53−/− from one experiment.
(D) RT-qPCR measurement of Fgf9, Fgf10 and Fgfr2 expression in E13.5 control (ShhCre Cenpj+/lox) and Cenpj loss of function (ShhCre Cenpj−/lox) lungs. Fgf10 was up-regulated. Data from 3 independent experiments were analyzed in super plot.
(E) In situ hybridization of Fgf10 in E12.5 control (ShhCre Cenpj+/lox) and Cenpj loss of function (ShhCre Cenpj−/lox) lungs. Scale bar, 1 mm.
(F-G) Immunostaining of phospho-ERK (pERK) in E13.5 (F) and E17.5 (G) control (ShhCre Cenpj+/lox) and Cenpj loss of function (ShhCre Cenpj−/lox) small intestine sections. Inlets depicted amplified view of epithelium. Scale bar denotes 50 μm and 100 μm, respectively.
(H) Immunoblots of phospho-ERK (pERK) and total ERK (ERK) in control (ShhCre Cenpj+/lox) and Cenpj loss of function (ShhCre Cenpj−/lox) lung and small intestine at E13.5. We quantified the ratio of pERK:ERK densitometry. n=3.
(I) Schematic showing the distribution of ERK activity (magenta) in developing lung and intestine.

