
FIGURE 7.
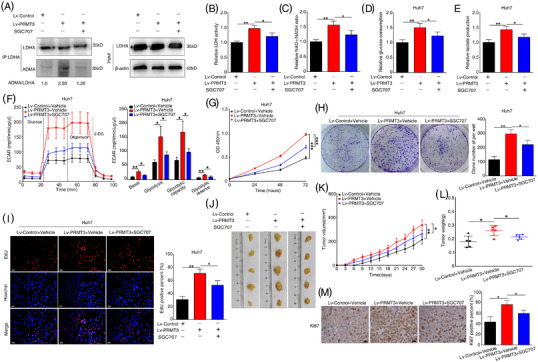
Protein arginine methyltransferase 3 (PRMT3) inhibitor SGC707 abolishes hepatocellular carcinoma (HCC) growth and glycolysis. (A) Lactate dehydrogenase A (LDHA) proteins were immunoprecipitated from the indicated HCC cells, including control HCC cells with DMSO treatment for 48 h, PRMT3‐overexpressing cells with dimethyl sulfoxide (DMSO) treatment for 48 h and PRMT3‐overexpressing cells with SGC707 (1 μM) treatment for 48 h, then subjected to Western blotting assays to detect the level of asymmetric dimethylarginine (ADMA) (n = 3). (B) Lactate dehydrogenase (LDH) activity assays of the indicated HCC cells (n = 3). (C) Nicotinamide‐adenine dinucleotide (NAD)+/reduced form of NAD (NADH) assays of the indicated HCC cells (n = 3). (D) Relative glucose consumption of the indicated HCC cells (n = 3). (E) Relative lactate production of the indicated HCC cells (n = 3). (F) Extracellular acidification rate (ECAR) measured in the indicated HCC cells. Column statistics was shown in the right panel (n = 3). (G) Cell counting kit‐8 (CCK‐8) assays showed the proliferation capacities of the indicated HCC cells (n = 3). (H) Colony formation assays were used to analyse the proliferation abilities of the indicated HCC cells (n = 3). (I) EdU assays were performed to detect the proliferation of the indicated HCC cells (n = 3, scale bars: 50 μm). (J–L) The subcutaneous HCC xenograft model was established and xenograft nude mice were intraperitoneally administrated with SGC707 or vehicle every 2 days at a dose of 30 mg/kg from the day after subcutaneous injection. (J) Images of subcutaneous tumours (n = 5 for each group). (K) Tumour growth curves of each group. (L) Tumour weight of the tumours. (M) Representative Ki‐67 staining images showed the proliferation of xenografts in the indicated groups (scale bars: 20 μm). The experiments were replicated n times, and the data are represented as mean ± S.D. *p < .05, **p < .01, ***p < .001