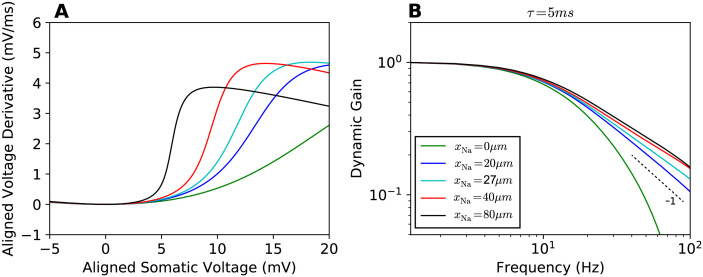
Fig 2. Phase plot and linear response functions.
A Phase plots for the APs seen at the soma, somatic voltage rate of change vs. somatic voltage for different sodium channel positions xNa (legend in B). The local minima of all curves are aligned at (0mV, 0mV/ms). B Dynamic gain functions for different xNa, normalized. 95% confidence intervals are plotted as shaded areas, mostly hidden by the line width. All curves are above statistical significance threshold (see Methods). The input current correlation time was set to τ = 5ms.

