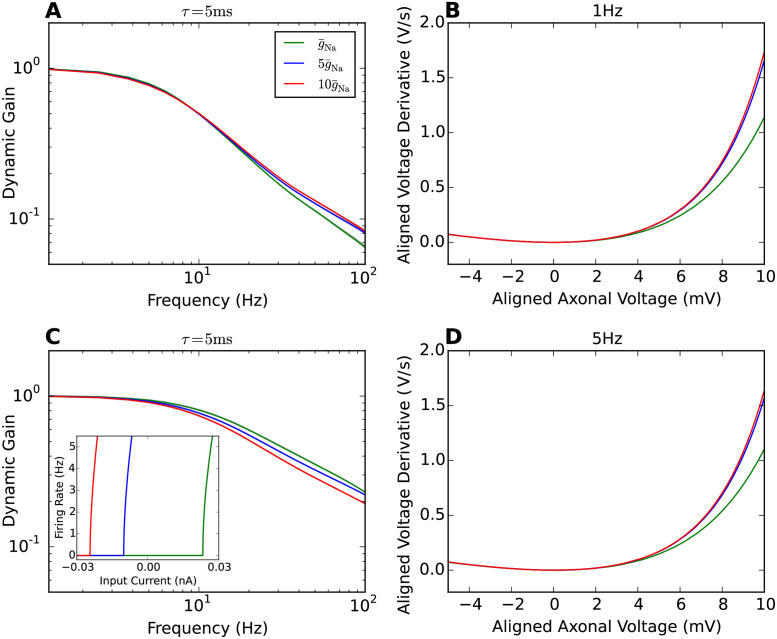
Fig 4. AP initiation dynamics and dynamic gain comparisons for difference sodium peak conductances.
A Dynamic gain functions of neuron models with different sodium peak conductances for 1Hz firing. The CV is 0.9±0.05. B Phase plots of AP initiation dynamics of Brette’s models with different sodium peak conductances. xNa is fixed to 40μm. Sodium peak conductance is increased 5 and 10 fold separately in comparison with the original model. To compare the AP initiation speed, each neuron model is injected with a constant input that generates 1Hz firing rate. C Dynamic gain functions of neuron models with different sodium peak conductances for 5Hz firing. The CV is 0.85±0.05. The inset in panel C shows the F-I curve for the three sodium peak conductance used. D Phase plots of AP initiation dynamics at 5Hz firing.

