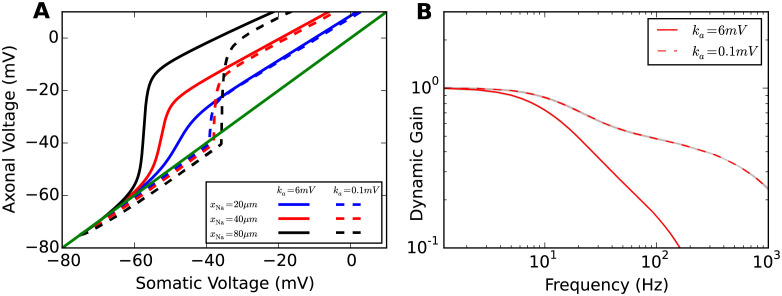
Fig 7. Impact of voltage sensitivity of sodium current activation curve on voltage decoupling under current clamp and dynamic gain.
A Plot of axonal voltage at xNa vs. somatic voltage for different sodium channel positions. Solid lines are voltage traces for low voltage sensitivity ka = 6mV, dashed lines denote the traces for high voltage sensitivity ka = 0.1mV. B Dynamic gain functions for the different voltage sensitivities for xNa = 40μm and τ = 5ms. The dynamic gain curve for the intermediate value ka = 1mV and longer correlation times can be found in S3 Fig.

