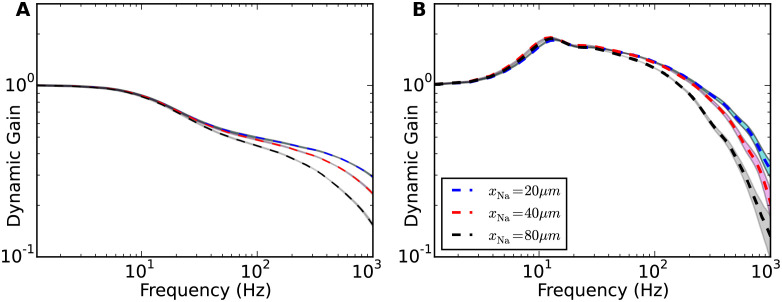
Fig 8. Increased impact of current correlation time for high voltage sensitivity.
Dynamic gain curves are plotted for A a short input current correlation time τ = 5ms and B a long correlation time of τ = 50ms. Dashed lines as in Fig 7B. Shaded areas are 95% confidence intervals. Colors denote different initiation site positions (see legend).

