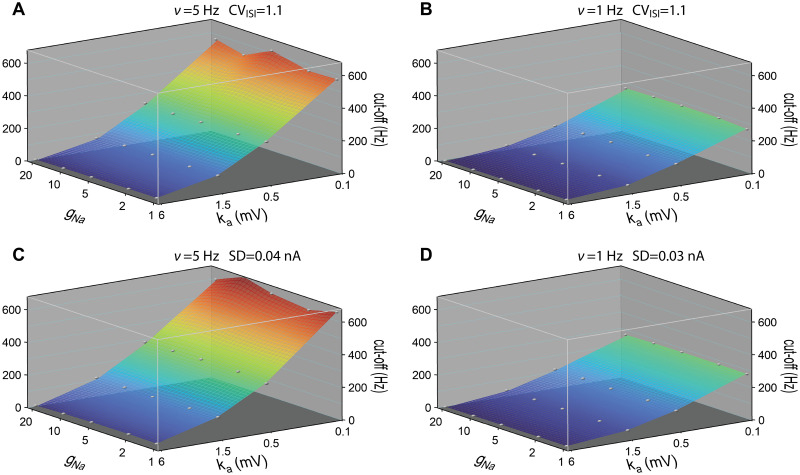
Fig 9. Cutoff frequencies of dynamic gain curves as a function of sodium peak conductance and voltage sensitivity of sodium activation curve.
A and B For each pair of voltage sensitivity and sodium peak conductance, the dynamic gain curve was calculated at 5Hz and 1Hz firing rates working points. CV values were fixed at 1.1 ± 0.05. C and D The dynamic gain curves were calculated at 5Hz and 1Hz firing rate with std of stimuli fixed at 0.04nA and 0.03nA. Correlation time of background current was 50ms. xNa fixed at 40μm. Sodium peak conductance ranged from to . ka ranged from 0.1 to 6mV. Conductance and sensitivity are represented on a logarithmic scale. Grey points represent calculated data, continuous surfaces are obtained by Voronoi interpolation to allow for a continuous color representation.

