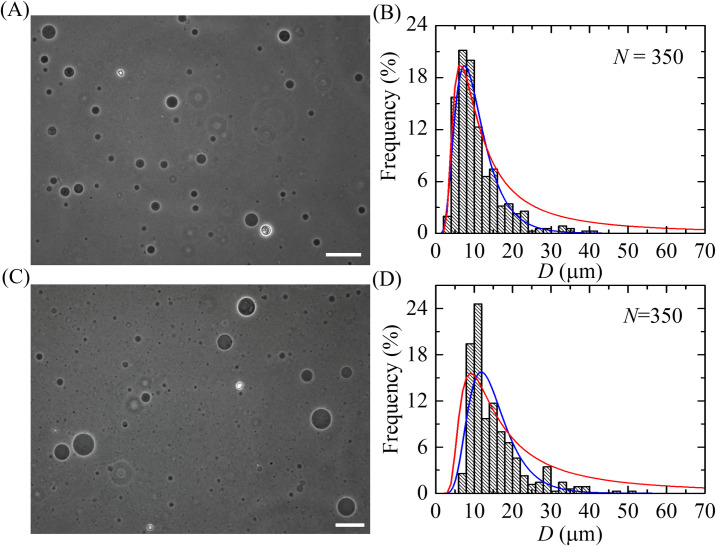
Fig 2. Effects of cholesterol on the size distribution of GUVs containing neutral membranes.
(A) and (B) show a phase contrast image and a size distribution histogram of DOPC/chol (100/0)-GUVs, respectively. (C) and (D) show a phase contrast image and a size distribution histogram of DOPC/chol (71/29)-GUVs, respectively. The bar in the images corresponds to 50 μm. N is the number of measured GUVs in each independent experiment. The blue lines show the best fitting curves of Eq 1. The parameters in (B) are μ = 2.25, σ = 0.49, and in (D) are μ = 2.63, σ = 0.39. The values of the coefficient of determination, R2, are obtained 0.91 in (B) and 0.95 in (D) from the fitted (blue) curves. The red lines show the best fitting theoretical curves corresponding to the Eq 7. The fitting parameters in (B) are Kben = 19.0 kBT, Dfreq = 6.4 μm, L = 3535, and in (D) are Kben = 28.5 kBT, Dfreq = 9.1 μm and L = 4230. The values of R2 in (B) and (D) are obtained 0.92 and 0.69, respectively from the fitted (red) curves.

