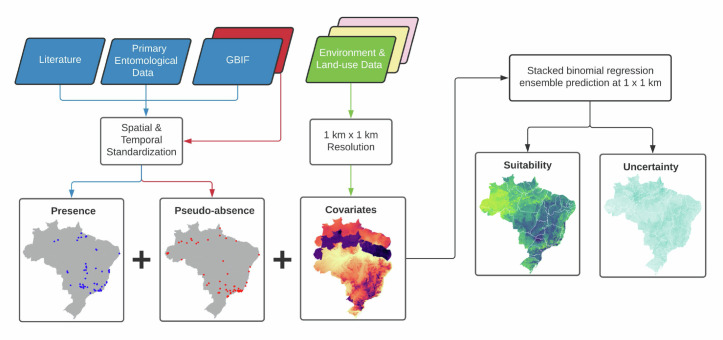
Fig 1. Schematic diagram of the modelling approach adopted to produce maps of environmental suitability for Haemagogus spp. and Sabethes spp. at 1 km x 1 km resolution.
The base layer of the map was retrieved from https://www.ibge.gov.br/geociencias/downloads-geociencias.html.

