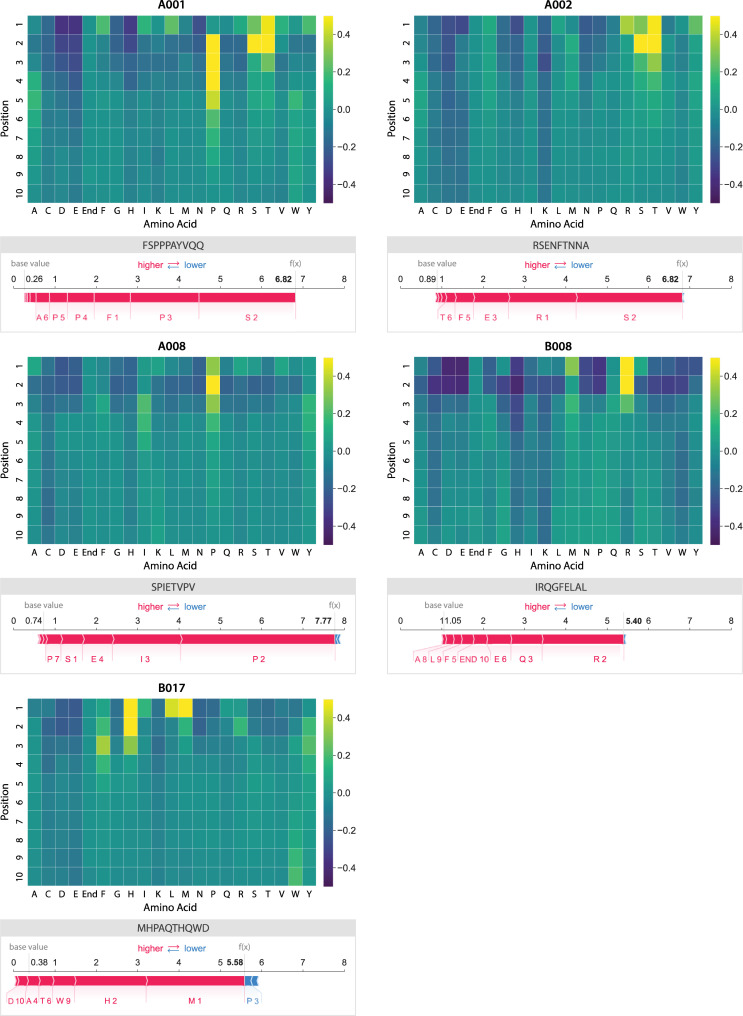
Fig 3. Heatmaps showing PoSHAP analysis to determine amino acid binding motifs from deep learning models.
The mean SHAP values for each amino acid at each position across all peptides in the test set were arranged into a heatmap. The position in each peptide is along the y-axis and the amino acid is given along the x-axis. “End” is used in positions 9 and 10 to enable inputs of peptides with length 8, 9, or 10. For comparison, the SHAP force plot for the peptide with the highest binding prediction is shown below each allele.

