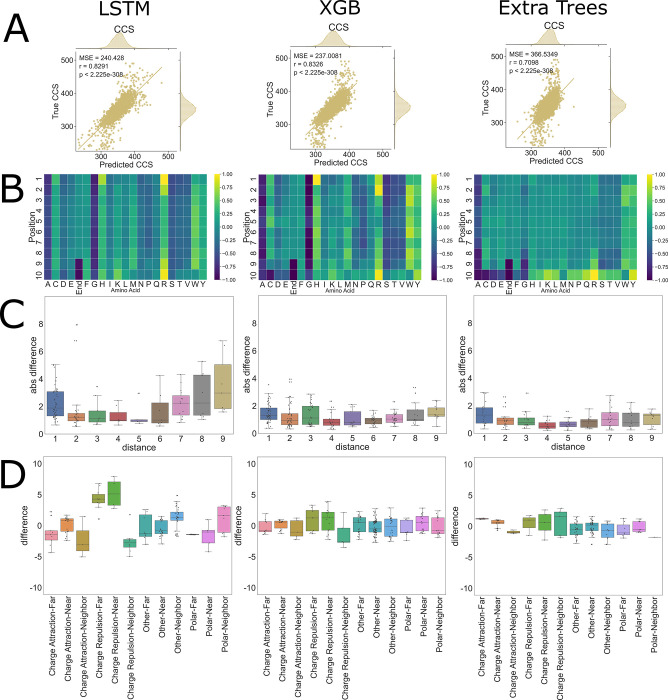
Fig 8. CCS PoSHAP of Various Machine Learning Models.
PoSHAP analysis was performed on two additional machine learning models, Extra Trees, and Extreme Gradient Boosting (XGB). (A) Predictions were plotted against experimental values and the Mean Squared Error and r values are reported for each model. (B) PoSHAP heatmaps were created for each model, standardized by the highest value in each heatmap, illustrating an increase in model complexity as more sophisticated models are used. Dependence analysis was performed on each model and the significant interactions are plotted by (C) distance and by (D) combined distance and interaction type.

