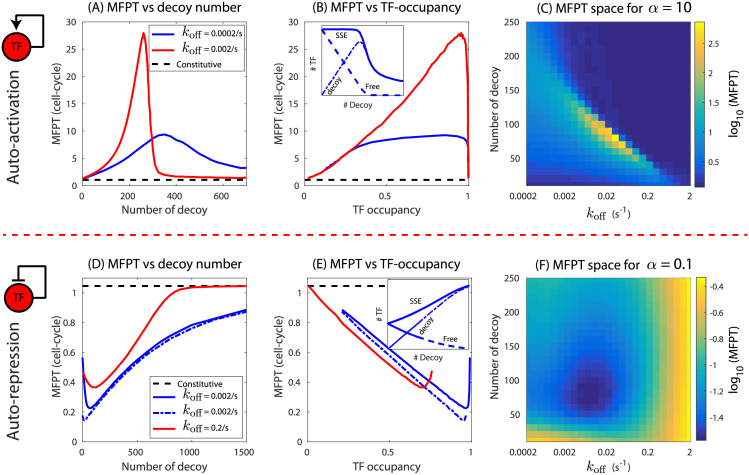
Fig 4. MFPT of an auto-regulated gene in a network of competing binding sites.
The MFPT of an auto-activated gene as a function of (A) number of competitive binding sites and (B) steady-state occupancy of TF at the promoter when decoy number is varied. The red curve is for weaker TF binding while the blue curve is for stronger TF binding. Inset: MFPT as function of free TF in steady state. Black dashed lines correspond to MFPT of a constitutive gene of transcription rate r0. (C) Heatmap showing phase space of MFPT in number of competing binding sites and affinity space for auto-activating gene (α = 10). (D,E) The MFPT of an auto-repressed gene as a function of competing binding sites and steady-state occupancy. Dashed blue line correspond to complete repression (α = 0). Inset: MFPT as function free TF in steady state. (F) Heatmap showing phase space of MFPT in number of competing binding sites and affinity space for auto-repressing gene (α = 0.1). We use α = 10, b = 0.05 s−1mRNA−1, r0 = 0.0025 s−1 (activation) and α = 0.1, b = 0.05 s−1mRNA−1, r0 = 0.05 s−1 (repression). γ = 0.0003 s−1 is used for protein degradation corresponding to τ = 38.5 min, all additional parameter values listed in the Materials and methods.

