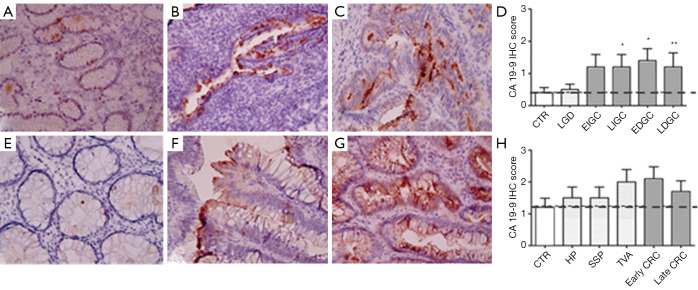
Figure 4.
Immunohistochemical analysis of CA 19-9 expression in gastric and colon tissues. (A) control gastric mucosa; (B) low grade dysplasia; (C) intestinal type gastric cancer samples. (E) colon tissues preneoplastic lesions (hyperplastic polyps and sessile serrated polyps); (F) tubular adenoma; (G) colorectal adenocarcinoma samples. Magnification ×200. Two-way ANOVA followed by Bonferroni post test analysis of IHC score values of gastric (D) and colon (H) cancer samples at different stages of disease. *, P<0.05; **, P<0.01 ((Figure S1C). 0–1 = negative/borderline; 1 = weakly expressed; 2 = expressed; 3 = strongly positive.

