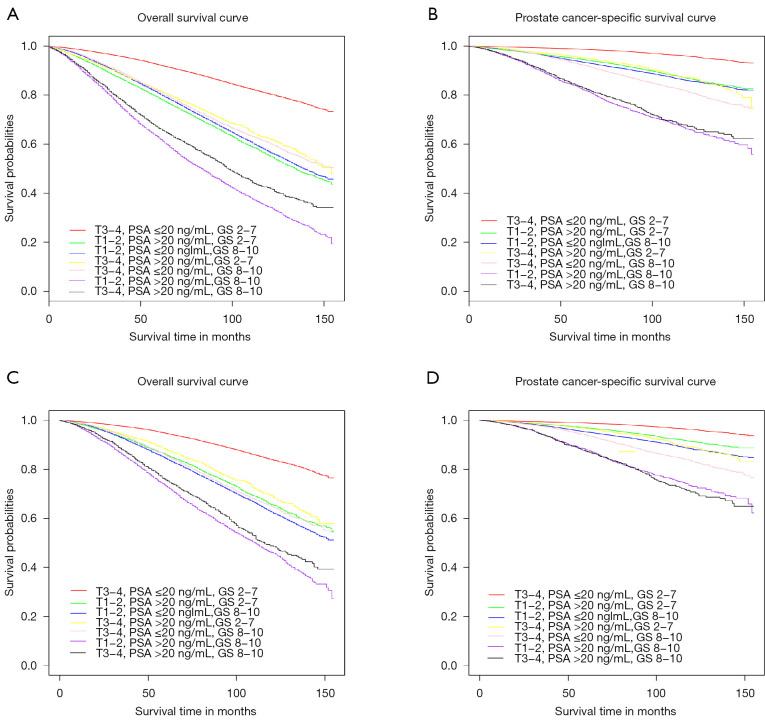
Figure 1.
The survival curves of all possible high-risk groups. (A) The OS curve of overall cohort; (B) the PCSS curve of overall cohort; (C) the OS curve of cohort with LTs; (D) the PCSS curve of cohort with LTs. OS, overall survival; PCSS, prostate cancer-specific survival; LT, local treatment; PSA, prostate-specific antigen; GS, Gleason score.

