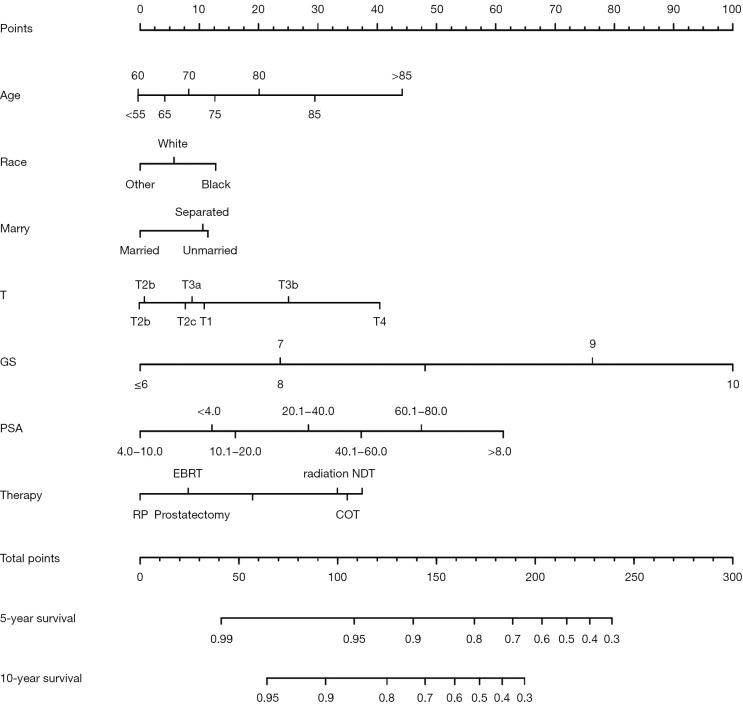
Figure 3.
The nomogram model of predicting the probability of PCSS in men with high-risk PCa based on the factors of age, race, marital status, T stage, PSA, GS and therapy. Instructions: Locate the patient’s level of every factor on the axis. Draw a line straight upward to the point axis to determine the points received from each factor. Sum all points of each factor and locate the final sum on the total-point axis. Draw a line straight down to find the patient’s 5- and 10-year PCSS rates. PCSS, prostate cancer-specific survival; PCa, prostate cancer; PSA, prostate-specific antigen; GS, Gleason score.

