
Figure 3.
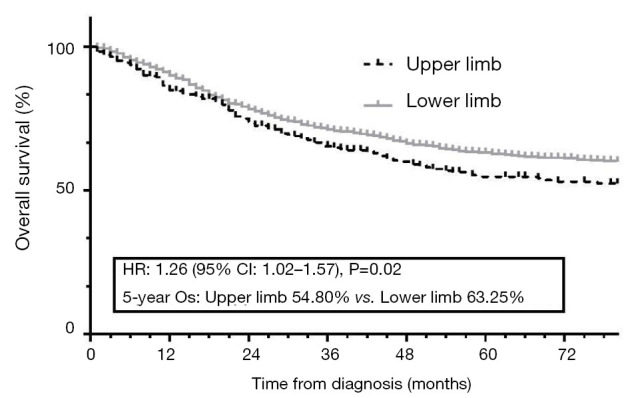
KM curves showed the survival difference between upper and lower limb patients. KM, Kaplan-Meier; OS, overall survival.
Official websites use .gov
A
.gov website belongs to an official
government organization in the United States.
Secure .gov websites use HTTPS
A lock (
) or https:// means you've safely
connected to the .gov website. Share sensitive
information only on official, secure websites.
KM curves showed the survival difference between upper and lower limb patients. KM, Kaplan-Meier; OS, overall survival.