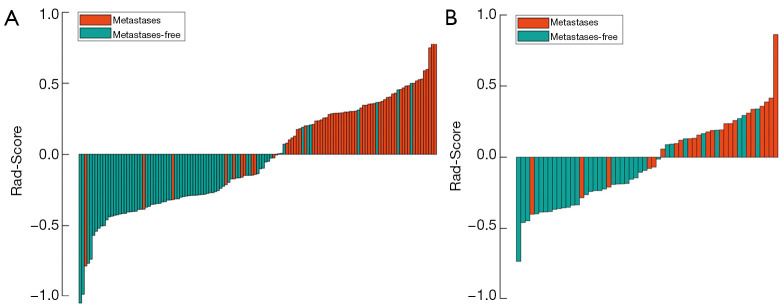
Figure 4.
Bar plot of the Rad-Score value for each patient in the training cohort (A) and the validation cohort (B). Patients with Rad-Score values ≥0 were considered as being at high risk for metastases, while patients with values <0 were deemed as being at low risk for metastases. Patients with and without BM are marked with different colors.

