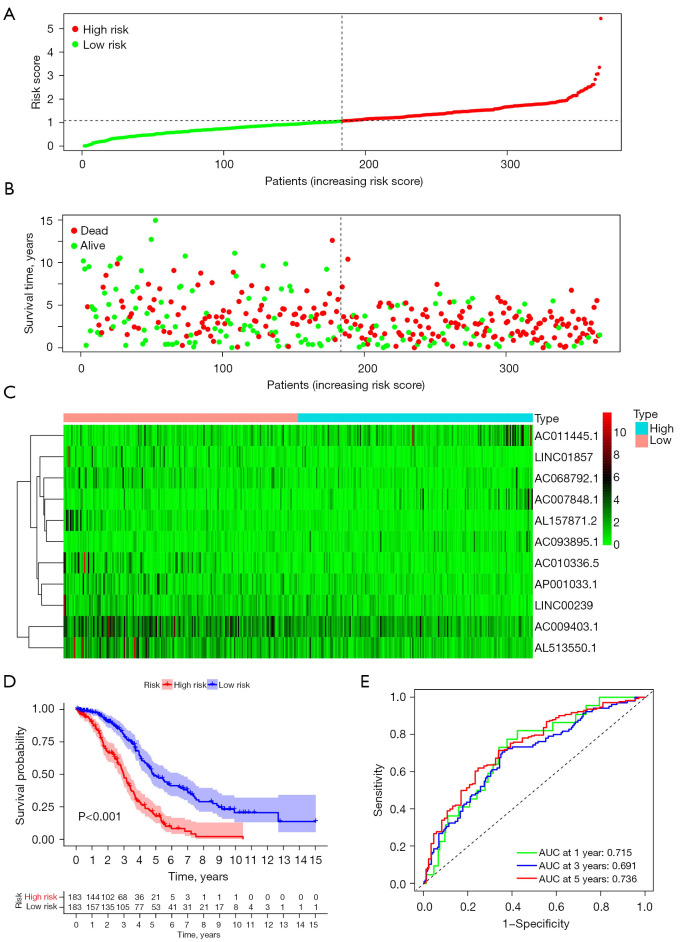
Figure 5.
Validation of the ferroptosis-related lncRNA signature in the entire set. (A) The OC patients’ risk score distribution. (B) Survival status of the OC patients. (C) Heatmap to show the expression of 11 lncRNAs between high- and low-risk groups. (D) A Kaplan-Meier survival analysis for evaluating the OS of patients in low- and high-risk groups. (E) ROC curve analysis for OC patients. OC, ovarian cancer; OS, overall survival; ROC, receiver operating characteristics.

