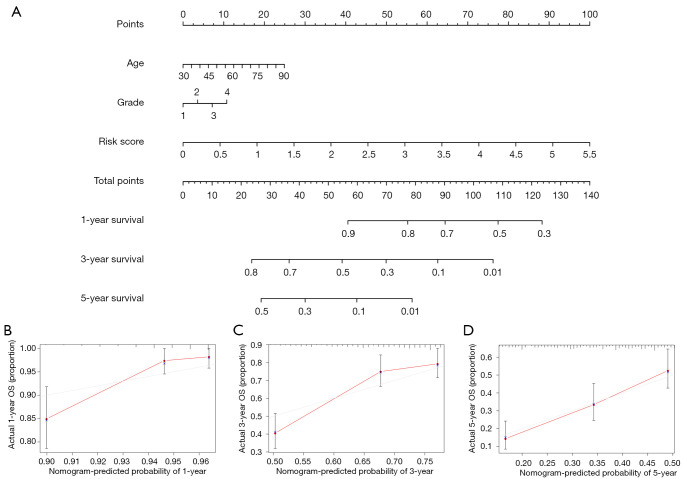
Figure 7.
Nomogram development and evaluation. (A) A nomogram for predicting OS in OC patients based on age, pathological grade, and risk score. The calibration curve for determining the strength of the nomogram’s power to predict 1-year (B), 3-year (C), and 5-year (D) OS. OS, overall survival; OC, ovarian cancer.

