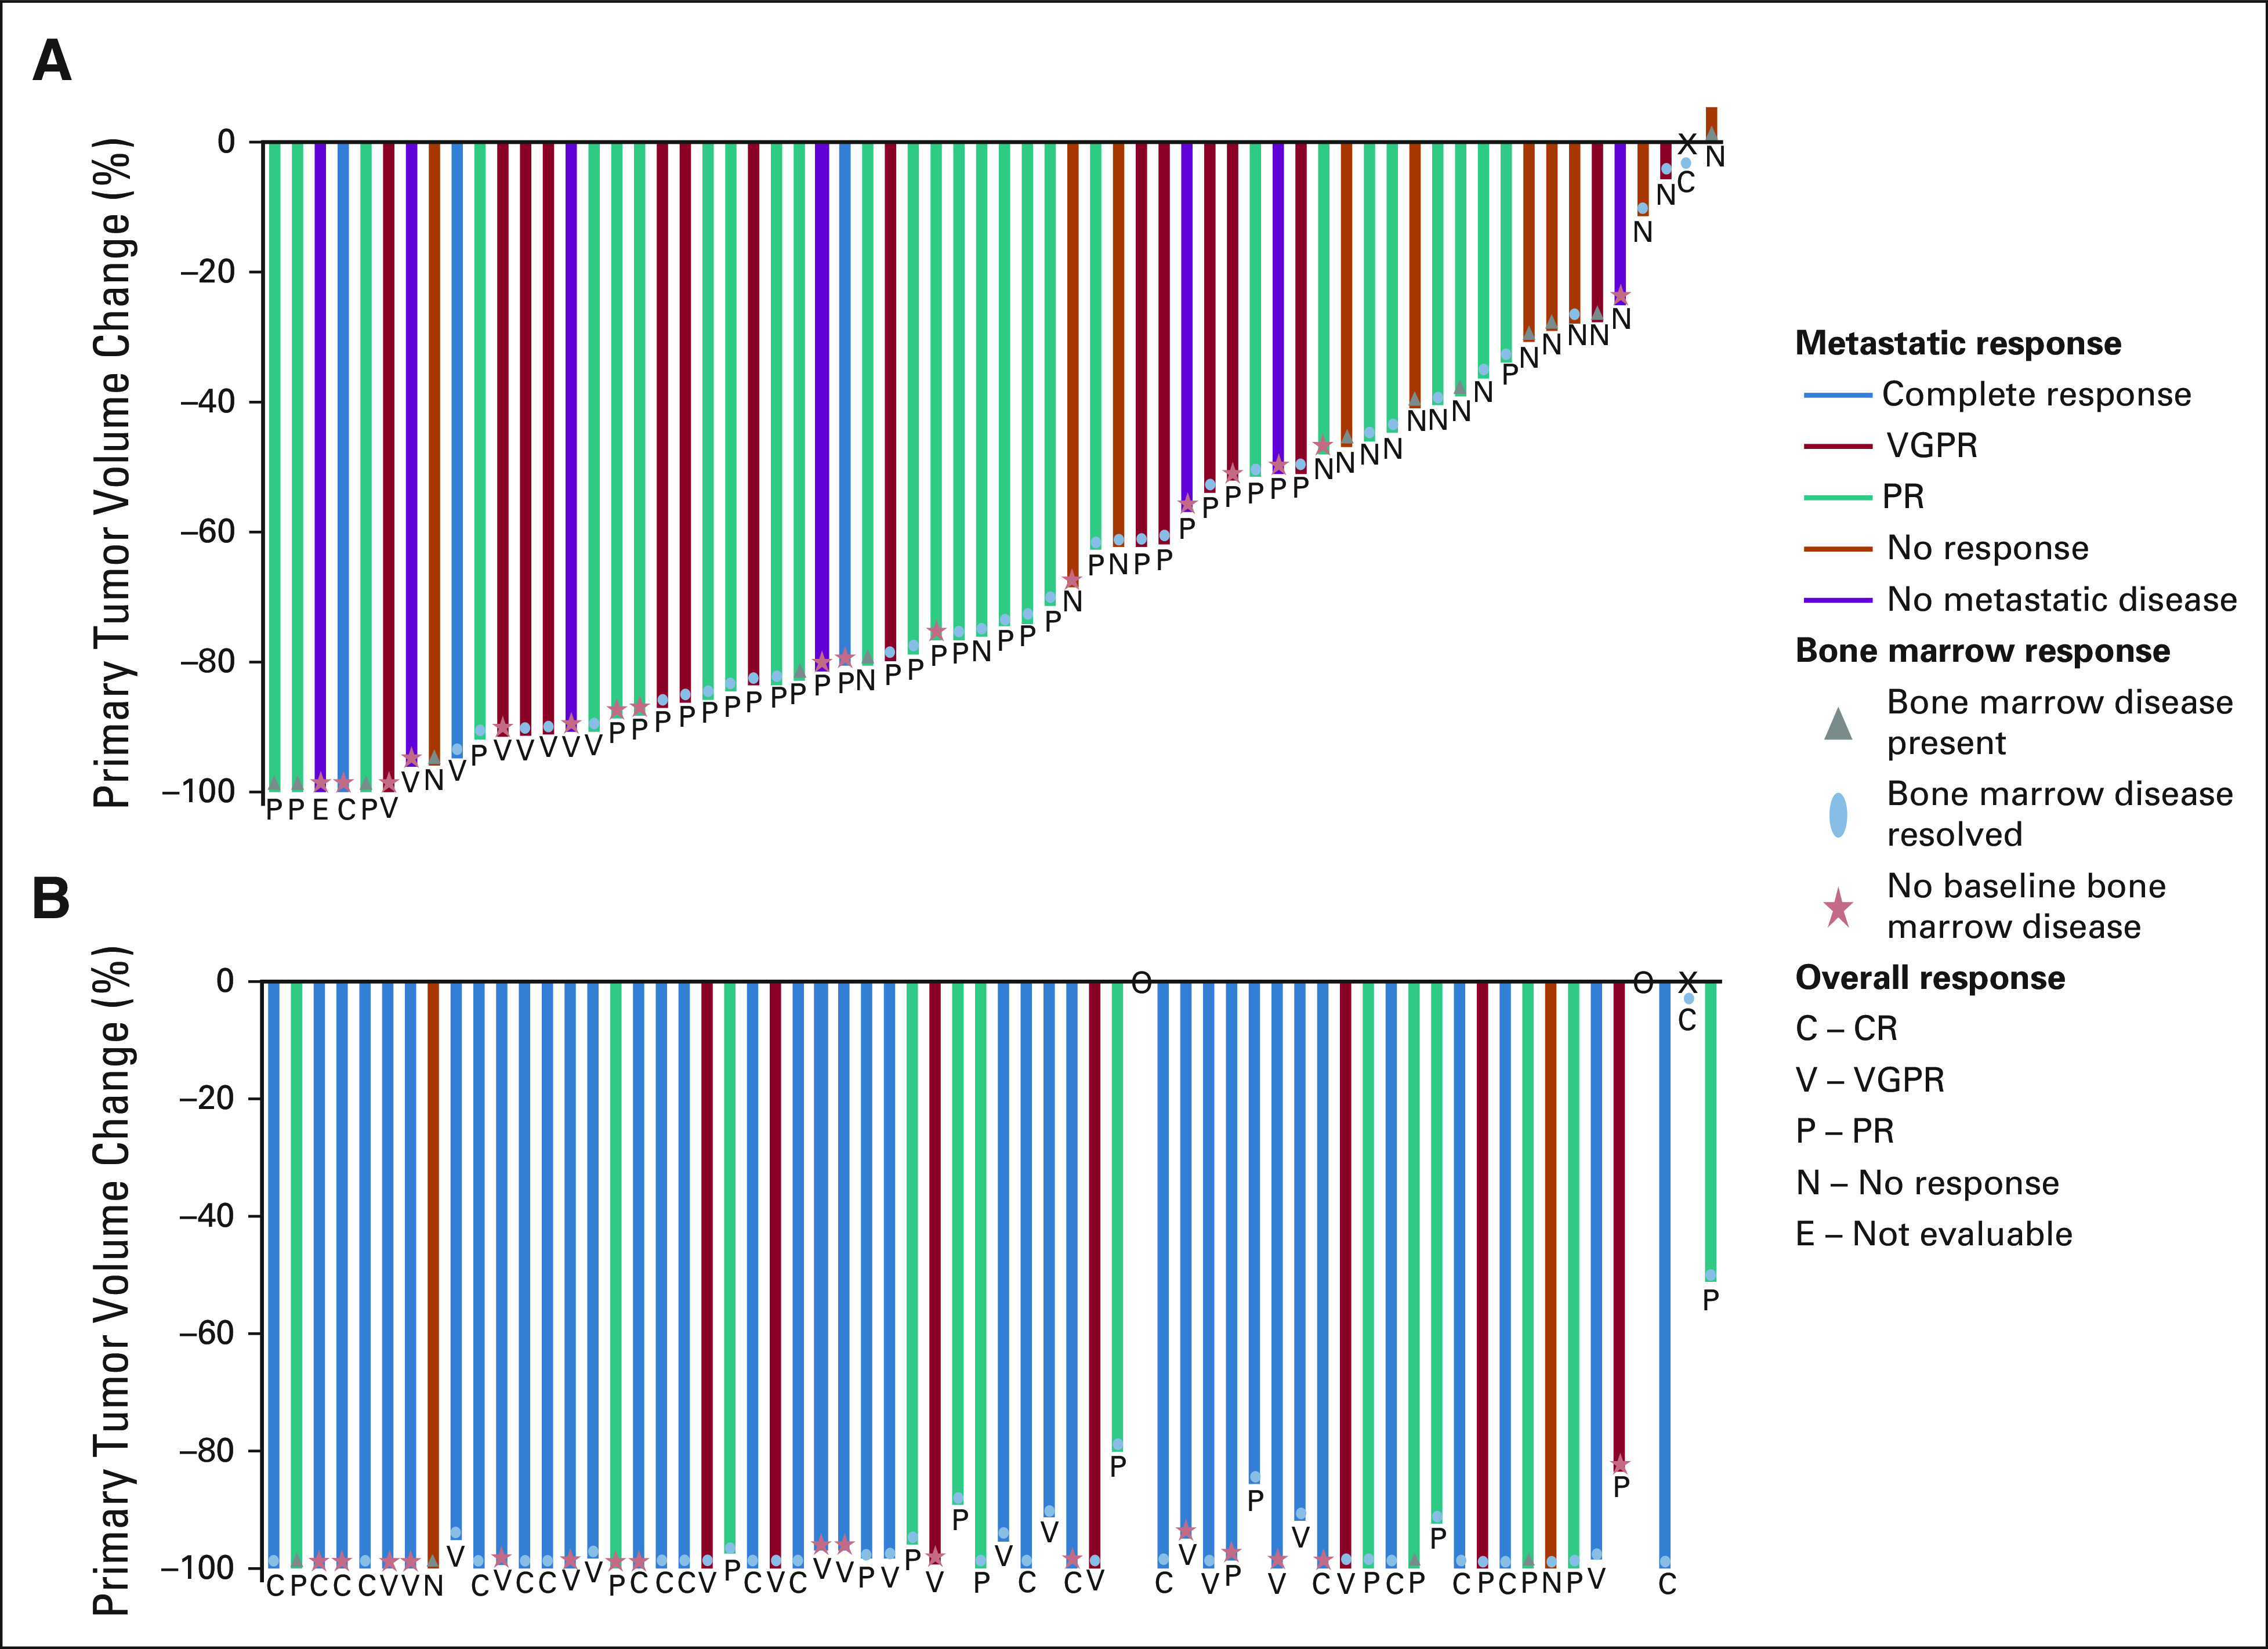
FIG 2.

Disease response assessed by INRC for patients (A) after induction cycle 2 and (B) at the end of induction. Each bar represents an individual patient. The primary tumor response is demonstrated as a percentile change in volume of the primary tumor compared with the primary tumor volume at baseline. The color of the individual bars signifies the metastatic response including anatomic imaging, functional imaging (MIBG or PET), and bone marrow assessment. The blue bar represents a complete metastatic response. The red bar represents a metastatic VGPR. The teal bar represents a metastatic partial response. The orange bar represents no metastatic response. The purple bar signifies patients without metastatic disease at diagnosis. Bone marrow response is depicted by the following shapes: gray triangle represents the presence of bone marrow disease at the time of the assessment, blue oval represents bone marrow disease present at baseline that resolved at the time of the assessment, and the red star represents no bone marrow disease at baseline. Together, the primary tumor response, metastatic response, and bone marrow response are used to inform the INRC overall response. The overall response of the individual patient is presented by the letter below each bar. The letter C signifies a CR; V is a VGPR; P is a PR; N is a no response; and E means that the patient was not evaluable at that time point because of the primary tumor resection performed before therapy. X represents a stage IV patient who did not have a primary tumor at diagnosis. O represents two patients who discontinued protocol therapy before completing induction. CR, complete response; INRC, International Neuroblastoma Response Criteria; MIBG, [125I]metaiodobenzylguanidine; PET, positron emission tomography; PR, partial response; VGPR, very good partial response.
