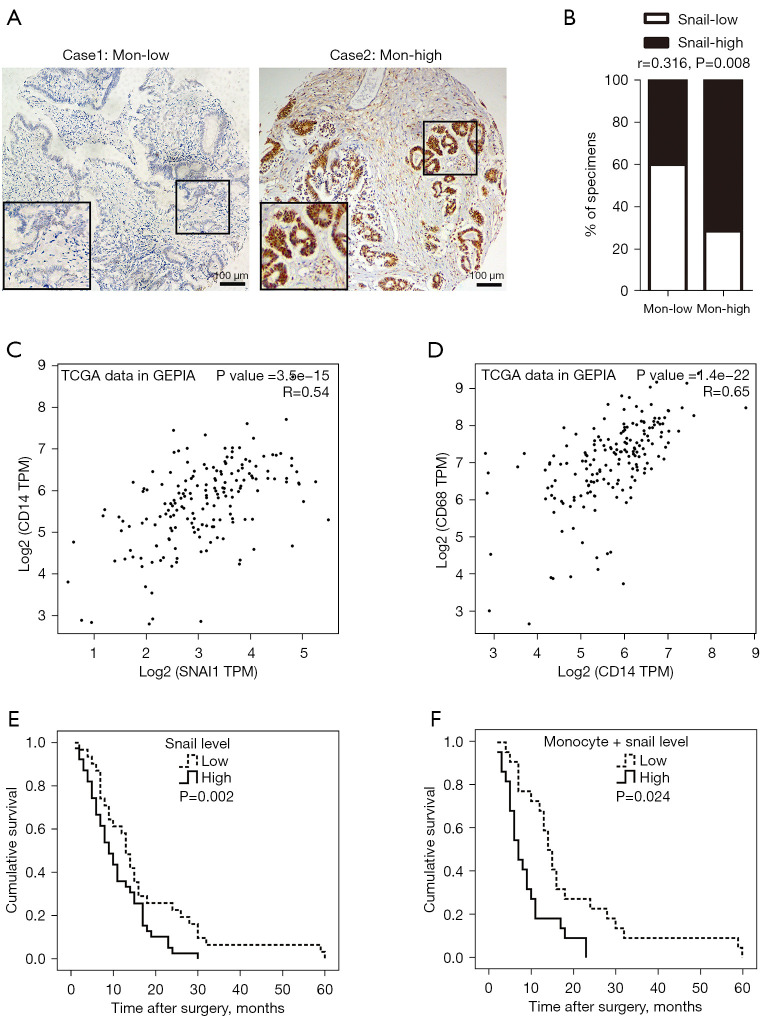
Figure 5.
The expression level of Snail was correlated with peripheral blood monocyte count and the patients’ outcome. (A) Representative images of IHC staining for Snail in PC tissue with high and low monocyte count. Magnification: 100×. Scale bars: 100 µm. (B) Percentage of samples showed low and high Snail expression relative to peripheral blood monocyte count. (C) The scatter plot demonstrated the correlation between the expression of Snail and CD14 by the GEPIA online tool. (D) Scatter plot demonstrated the correlation between the expression of CD14 and CD68 by the GEPIA online tool. (E,F) Correlation between overall survival of PC patients and Snail (E) expression, or both Snail and monocyte count (F). The Kaplan-Meier method and log-rank test were used for analysis. Expression level of: Snail-low (n=31), Snail-high (n=39); Snail-low + low-monocyte count (n=21), Snail-high + high-monocyte count (n=25). TCGA, The Cancer Genome Atlas; IHC, immunohistochemical; PC, pancreatic cancer; CD14, cluster of differentiation 14; GEPIA, Gene Expression Profiling Interactive Analysis.

