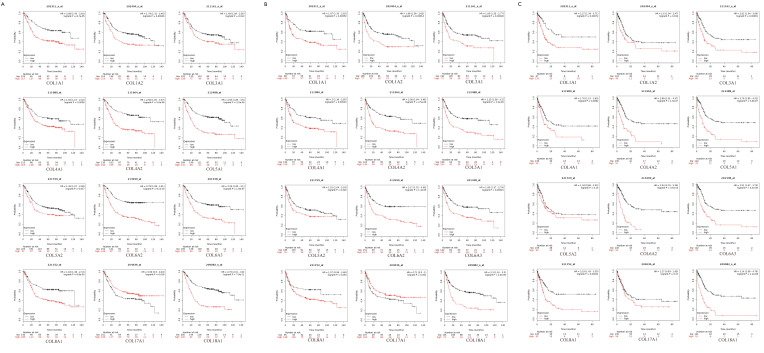
Figure S2.
Different mRNA level of collagens’ prognostic values in intestinal subtype gastric cancer patients (Kaplan-Meier plotter). Notes: Kaplan-Meier plots show the relationship between OS (A), FP (B) and PPS (C) and the expression of collagens in gastric cancer patients, respectively, with hazard ratio (HR) and statistical significance.

