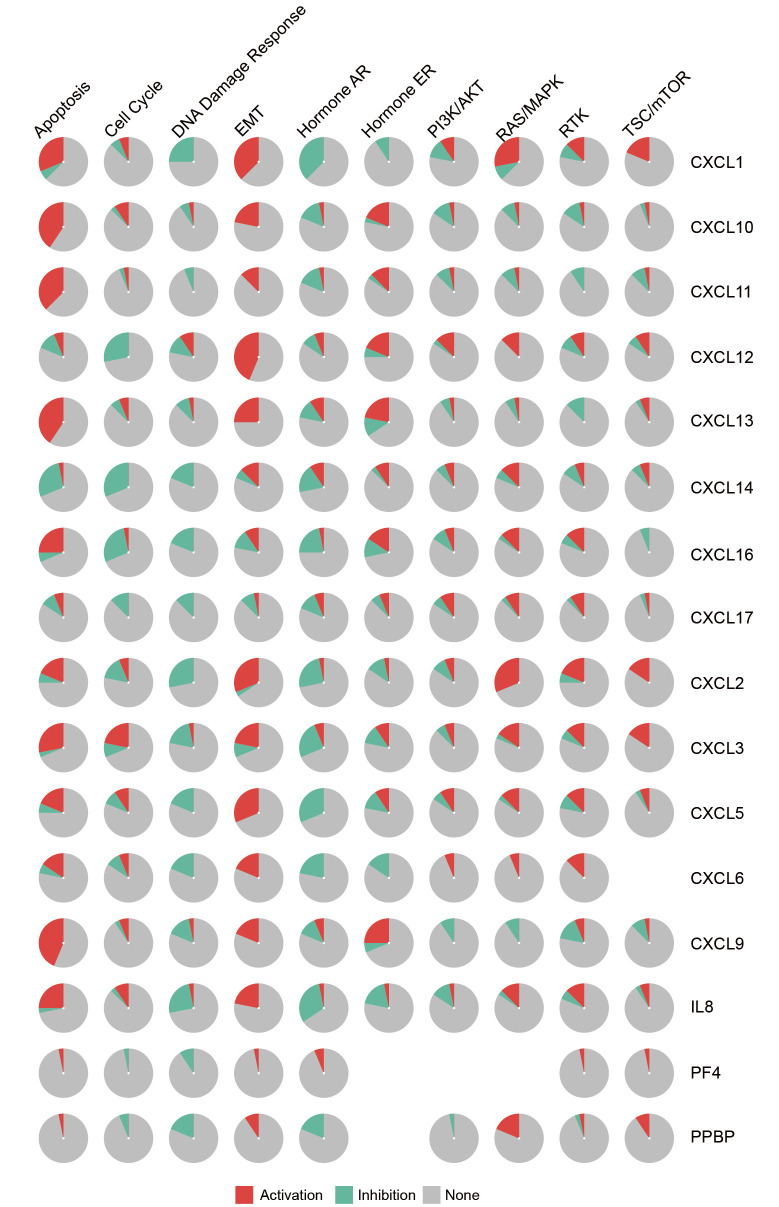
Figure 7.
The association between CXC chemokines and activity of ten cancer pathways (GSCALite). Red indicates the activation percentage of CXC chemokines to a pathway. Green indicates the inhibition percentage of CXC chemokines to a pathway. Grey indicates the percentage of CXC chemokines that have no effect on a pathway.

