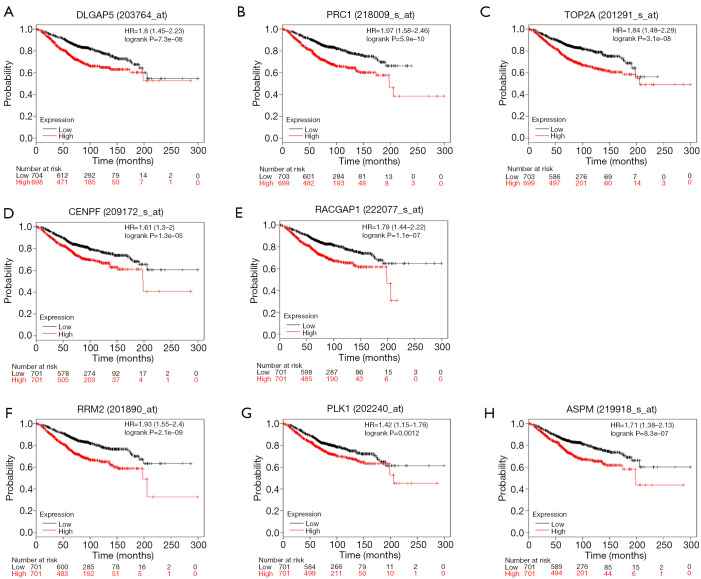
Figure 4.
Kaplan-Meier total survival analysis was performed for all DEGs in 1402 breast cancer patients from the TCGA database. (A) DLGAP5, P=7.3e−08; (B) PRC1, P=5.9e−10; (C) TOP2A, P=3.1e−08; (D) CENPF, P=1.3e−05; (E) RACGAP1, P=1.1e−07; (F) RRM2, P=2.1e−09; (G) PLK1, P=0.0012; (H) ASPM, P=8.3e−07. DEG, differentially expressed gene.

