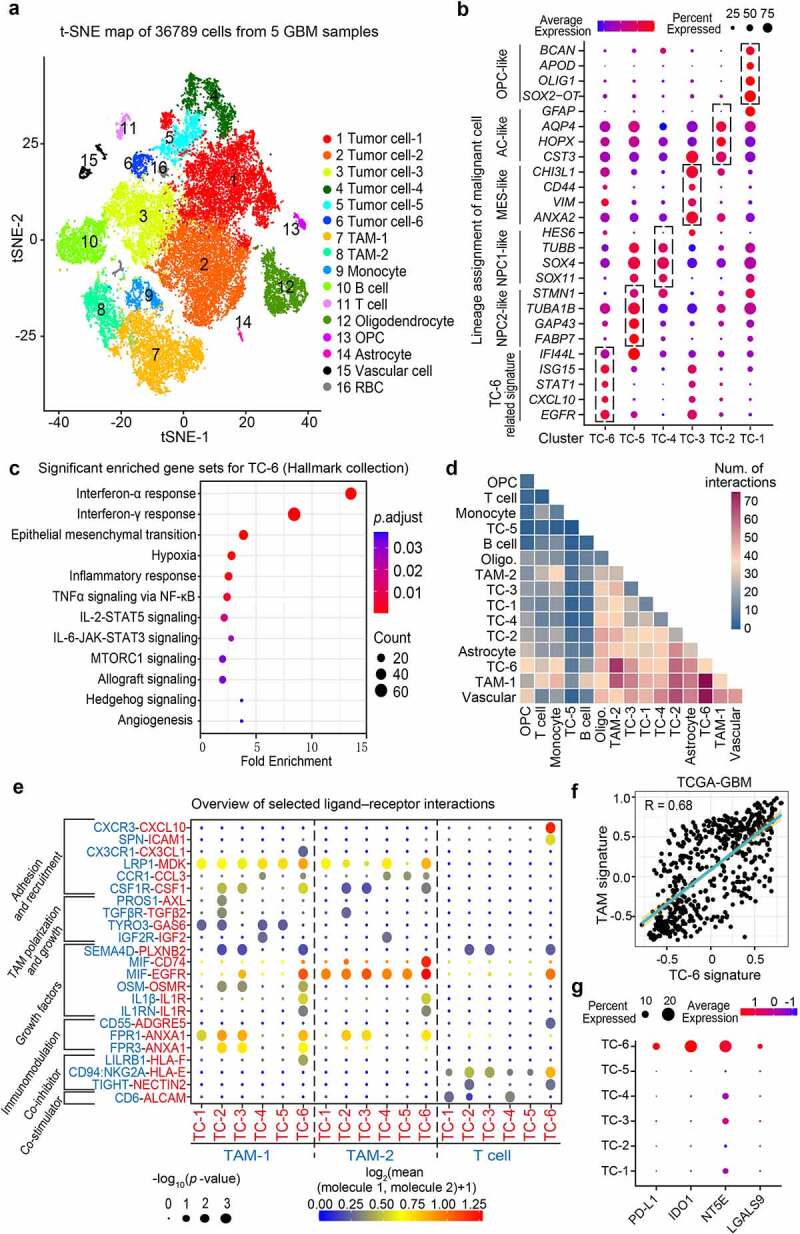
Figure 1.

Single-cell RNA sequencing identifies a novel tumor cell subset for orchestrating immunosuppression. (a) t-SNE plot showing 16 major cell types using the single-cell RNA sequencing data from 5 cases of GBMs. TAM, Tumor-associated macrophages; RBC, Red blood cell; OPC, Oligodendrocyte progenitor cell. (b) Dot plots showing the distinct cell state markers in the indicated tumor cell subsets (TC-1, -2, -3, -4, -5, and -6). Dot size was proportional to the fraction of cells expressing specific genes. Color intensity corresponds to the relative expression of specific genes. TC, Tumor cell; NPC, Neural progenitor cell; AC, Astrocyte; MES, Mesenchymal. (c) Enrichment analyses of the differential expressed genes in TC-6 versus other subsets (log2 fold-change > 0.5, min.pct > 0.10). The bubble size indicates the number of genes in each term, and different colors correspond to different adjusted p-values. (d) Heatmap showing the total number of interactions between cell types inferred from whole clusters of GBMs using CellphoneDB. Oligo., Oligodendrocyte. (e) Overview of representative ligand–receptor interactions between tumor cells and immune cells. P-values are indicated by circle size, the average expression of interacting molecules in cluster 1 and 2 are indicated by colors. (f) Correlation plot between TC-6 subset and TAM subset in TCGA GBM cohort, correlation coefficient was listed on the top. (g) Dot plots showing the expression of known immune checkpoints (PD-L1, IDO1, NT5E, and LGALS9) across the TC subsets.
