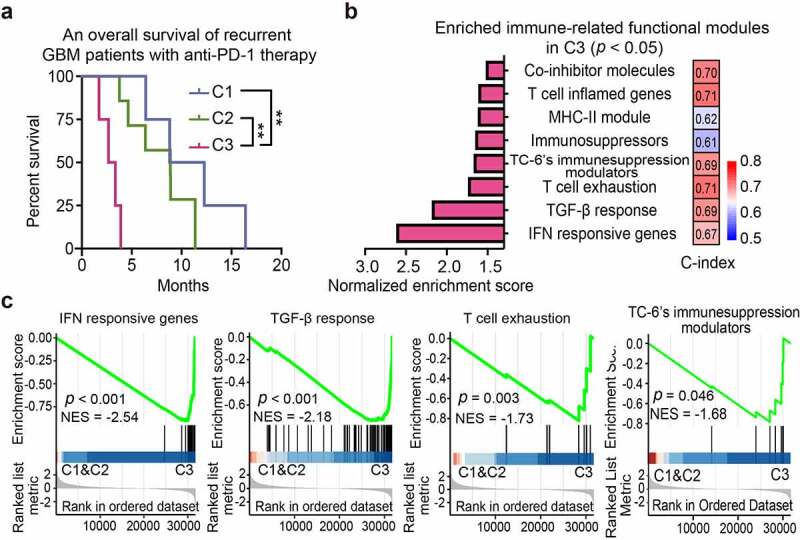
Figure 6.

C3 subtype predicts poor immunotherapeutic response. (a) Kaplan–Meier analyses of patient overall survival of anti-PD-1-treated GBMs with different subtypes (GSE121810). (b) GSEA analysis of enriched immune modules with statistical significance in C3 subtype relative to the non-C3 subtypes. The column plot (left panel) showed the normalized enrichment score of each module. Concordance index (C-index) was presented for the indicated characteristic immune module (right panel). Predictive power (high to low) was indicated as bar color (red to blue). (c) GSEA plots of the representative enriched functional modules in C3 subtype. NES, Normalized enrichment score.
