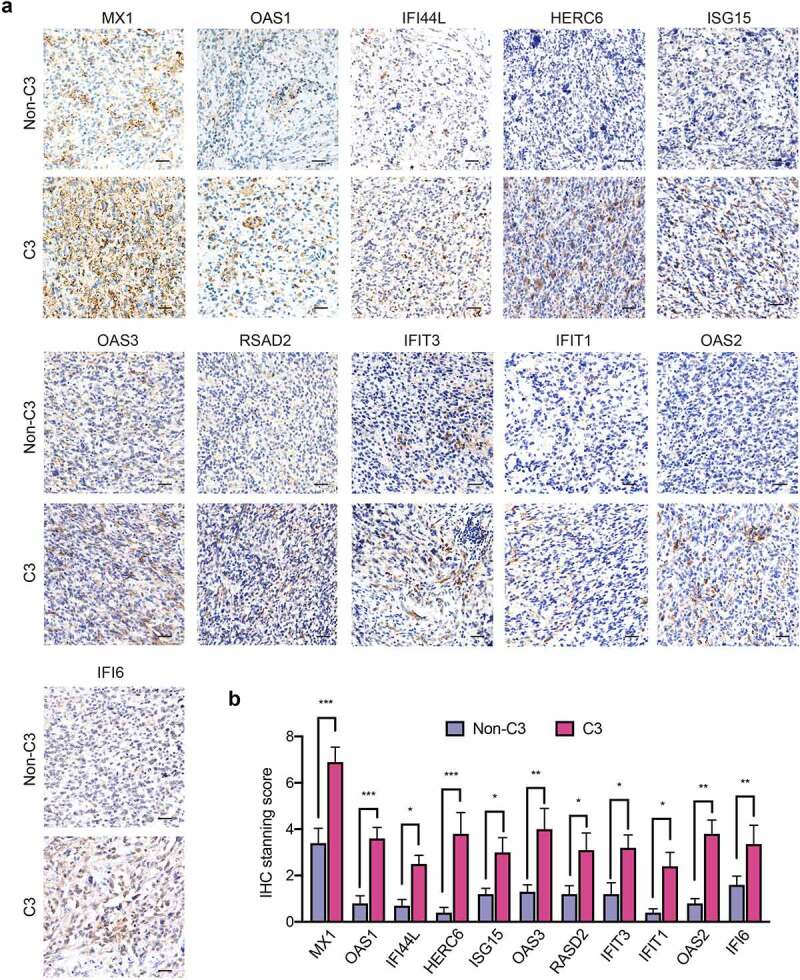
Figure 8.

IHC staining of 11 classifier genes in C3-subtype GBMs relative to non-C3-subtypes. (a) Representative IHC images showing the expressions of 11 classifier genes in human GBMs with C3 and non-C3 subtypes. Scale bar: 50 μm. (b) Semi-quantification of IHC staining of 11 classifier genes in human GBMs with C3 and non-C3 subtypes. ***, p < 0.001; **, p< 0.01; *, p < 0.05.
