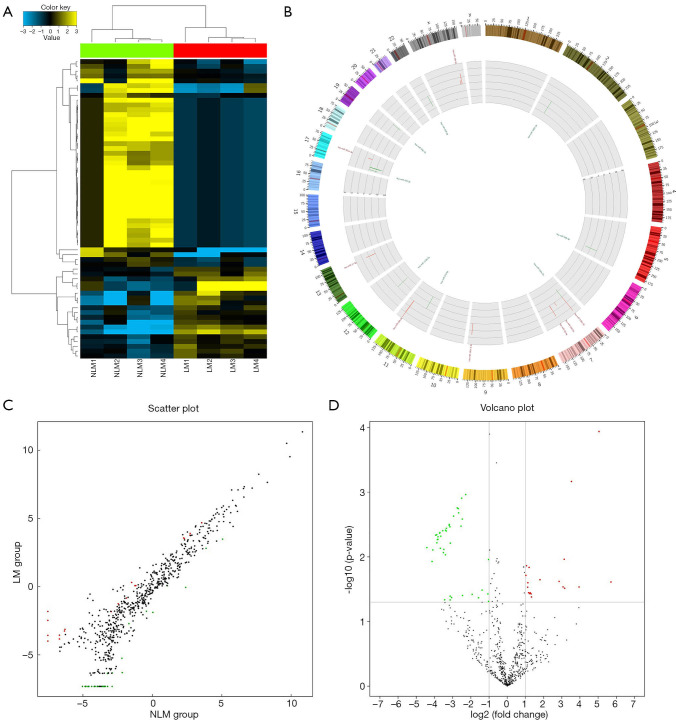
Figure 1.
Plots for the microarray analysis of the samples. (A) Hierarchical cluster analysis plots for the differentially expressed miRNAs in ESCC tissues with and without LNM show good similarities among cancer tissues of different groups. Yellow indicates relatively high expression and blue indicates relatively low expression of miRNAs. Each RNA is represented by a single row of colored boxes and each sample by a single column. (B) The Circos plot for the locations of differentially expressed miRNAs in ESCC tissues with and without LNM. Red represents significantly upregulated miRNAs, green represents significantly downregulated miRNAs, the length of the pillar represents a multiple of the difference. (C,D) The scatter plots and the volcano plots illustrate the distribution of miRNAs. Red dots represent miRNAs that are significantly upregulated, green dots represent miRNAs that are significantly downregulated, and black dots represent miRNAs without significant differences. LNM, lymph node metastasis; ESCC, esophageal squamous cell carcinoma.

