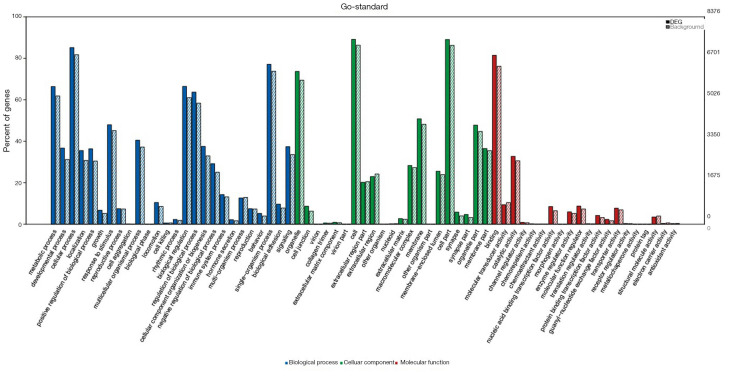
Figure 2.
GO enrichment analysis of miRNA target genes. The x-axis indicates GO terms, including biological process (blue), cell component (green), and molecular function (red). The y-axis includes three data series, percent of genes presented on the left, numbers of DEGs (black number), and background genes (gray number, representing all gene analyzed) on the right. The solid histogram represents DEGs and the virtual histogram represents background genes. GO, gene ontology; DEGs, differentially expressed genes.

