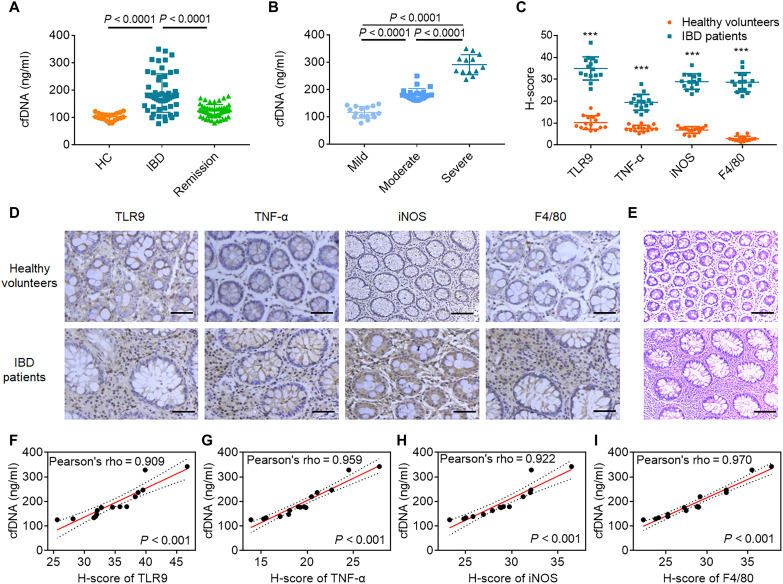
Fig. 1. Relationship between cfDNA and colonic inflammation in IBD patients.
(A) Serum levels of cfDNA in healthy volunteers (n = 20) and IBD patients (n = 52) with active IBD or in remission. (B) Serum levels of cfDNA in patients with IBD of different grades were determined using Truelove and Witts criteria (n = 52). In (A) and (B), data are means ± SEM; P values were assessed using Student’s t test with Tukey’s multiple comparison test. (C) Quantification of TLR9, TNF-α, iNOS, and F4/80 protein expression in healthy volunteers and IBD patients. Data are means ± SEM (n = 15; *P < 0.05, **P < 0.01, and ***P < 0.001 by Student’s t test). (D) Images of colon sections stained for TLR9, TNF-α, iNOS, and F4/80. (E) Images of H&E-stained colon sections. In (D) and (E), the scale bars represent 100 μm. (F to I) Linear regression curves illustrating the correlation between serum cfDNA level and (F) TLR9, (G) TNF-α, (H) iNOS, and (I) F4/80 protein expression in colon sections of IBD patients. In (D) to (I), data are means ± SEM (n = 15; *P < 0.05, **P < 0.01, and ***P < 0.001 by Student’s t test).

