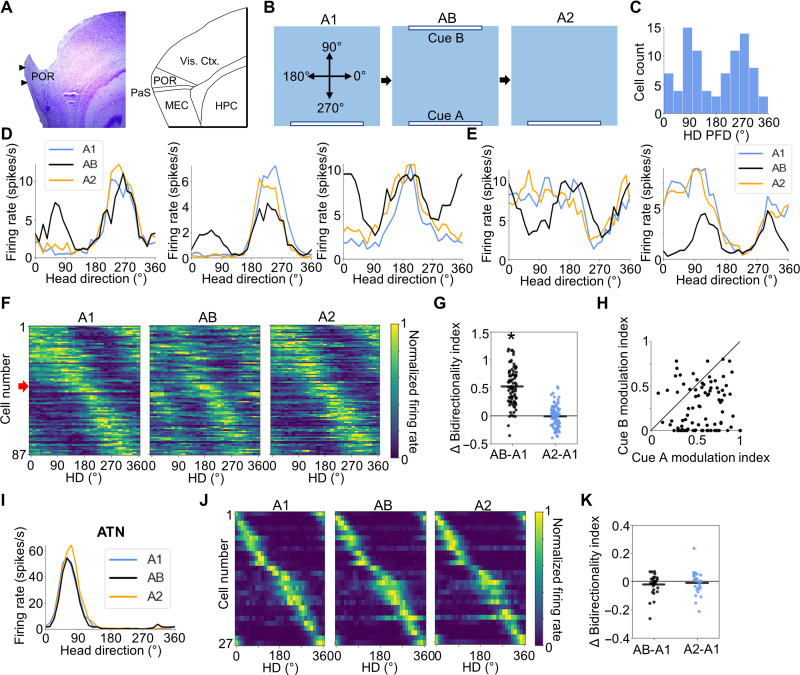
Fig. 1. AB session.
(A) Left: Nissl-stained sagittal section from one rat showing anatomical borders and cannula track through POR. Right: Atlas diagram showing anatomical borders between brain regions visible in the sagittal section to the left. PaS, parasubiculum; HPC, hippocampus. (B) Experimental design for the AB experiment. Top-down view of the recording arena showing the locations of visual cues across A1, AB, and A2 sessions, as well as the reference frame for measuring allocentric HD. (C) Histogram of A1 HD PFDs for all 87 POR LM-HD cells recorded in the AB experiment. Note the clustering around 270° (looking toward the cue) and 90° (looking away from the cue). (D) Tuning curves for three example POR LM-HD cells recorded across A1, AB, and A2 sessions that showed peak-locked tuning relative to the visual cues. (E) Same as (C) but for two LM-HD cells that showed trough-locked tuning. (F) Normalized tuning curves for all POR LM-HD cells recorded in the AB experiment. The first 40 cells show trough-locked firing, whereas the remaining 47 are peak-locked; this separation is indicated by a red arrow. (G) Comparison of BI between the initial A1 session and both AB and A2 sessions, showing an increase in bidirectionality during the AB session. Asterisk (*) denotes statistical significance. (H) Scatter plot depicting the degree of firing rate modulation attributed to cue A or cue B for all POR LM-HD cells recorded during the AB session. Black line shows x = y. Note that modulation was generally stronger for cue A than cue B. (I) Tuning curves for a representative ATN HD cell recorded across A1, AB, and A2 sessions. (J) Same as (F) but for ATN HD cells. (K) Same as (G) but for ATN HD cells.

