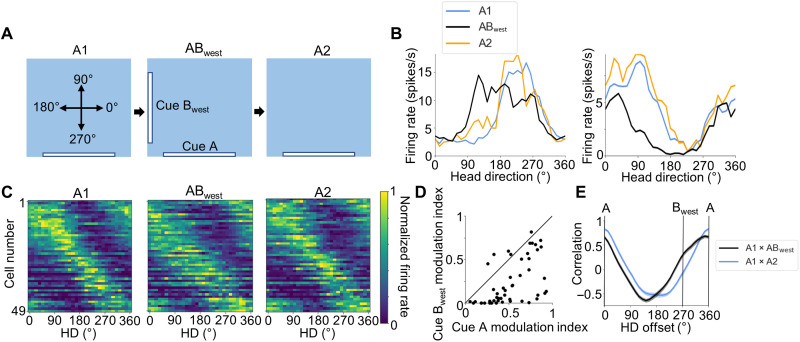
Fig. 2. ABwest session.
(A) Experimental design for the ABwest experiment. A top-down view of the recording arena demonstrating the locations of visual cues across A1, ABwest, and A2 sessions, as well as the reference frame for measuring allocentric HD. (B) Tuning curves for an example peak-locked POR LM-HD cell (left) and a trough-locked POR LM-HD cell (right) recorded across A1-ABwest-A2 sessions that showed broadening of their tuning curves in the direction of the new cue location. (C) Normalized tuning curves for all POR LM-HD cells recorded across the three sessions of the ABwest experiment. (D) Scatter plot showing the degree of firing rate modulation that each cell displayed relative to each cue. Note that modulation relative to cue A was generally stronger than to cue Bwest. Black line shows x = y. (E) Cross-correlation of tuning curves between A1 and A2 sessions (blue) and between A and Bwest sessions (black). Note that the A1 × ABwest correlations are shifted counterclockwise and show a small bump at 270° corresponding to the location of cue Bwest. The location of this bump is indicated by the vertical line labeled Bwest. Error bars show SEMs.

