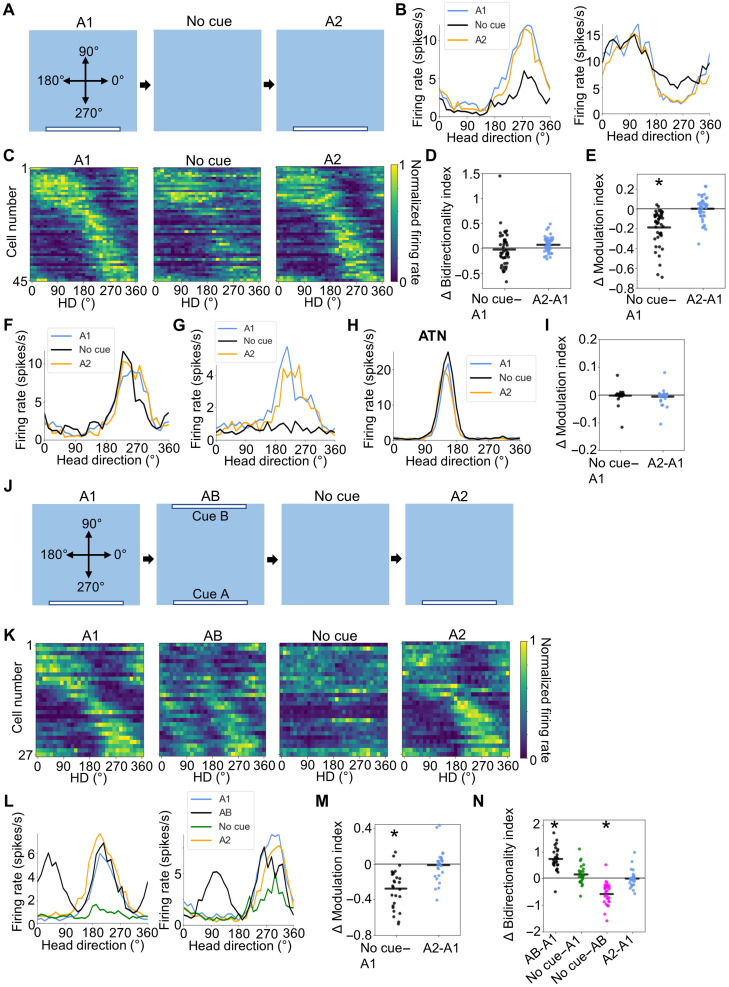
Fig. 3. No cue session.
(A) Top-down view of the A1–No cue–A2 experiment showing locations of visual cues. (B) Tuning curves for an example peak-locked POR LM-HD cell (left) and an example trough-locked cell (right) that reduced their tuning strength when cue A was removed. (C) Normalized tuning curves for all POR LM-HD cells recorded in the No cue experiment. (D) Comparison of BI between A1 and both No cue and A2 sessions. Note that cells did not become bidirectional during the No cue or A2 sessions. (E) Comparison of tuning strength as measured by the MI (see Methods) between the initial A1 session and both No cue and A2 sessions, showing a decrease in modulation during the No cue session. (F) Tuning curves for a POR LM-HD cell that stayed strongly tuned across all sessions. (G) Tuning curves for an example POR LM-HD cell that showed almost complete tuning degradation during the No cue session. (H) Tuning curves for an example ATN HD cell that maintained its firing properties across all sessions. (I) Change in MI between the A1 condition and both No cue and A2 conditions for ATN HD cells. (J) Experimental design for the A1–AB–No cue–A2 experiment. (K) Normalized tuning curves for all POR LM-HD cells recorded in the A1–AB–No cue–A2 experiment. (L) Tuning curves for two example peak-locked LM-HD cells. Note that both cells show bidirectionality during the AB session but not during the No cue session where they show unidirectional firing of reduced magnitude. (M) Comparison of tuning strength (MI) between the initial A1 session and both No cue and A2 sessions, showing a decrease in tuning strength for the No cue session. (N) Comparison of BI between different sessions. Only the AB session displayed increased bidirectionality. Asterisk (*) denotes statistical significance.

