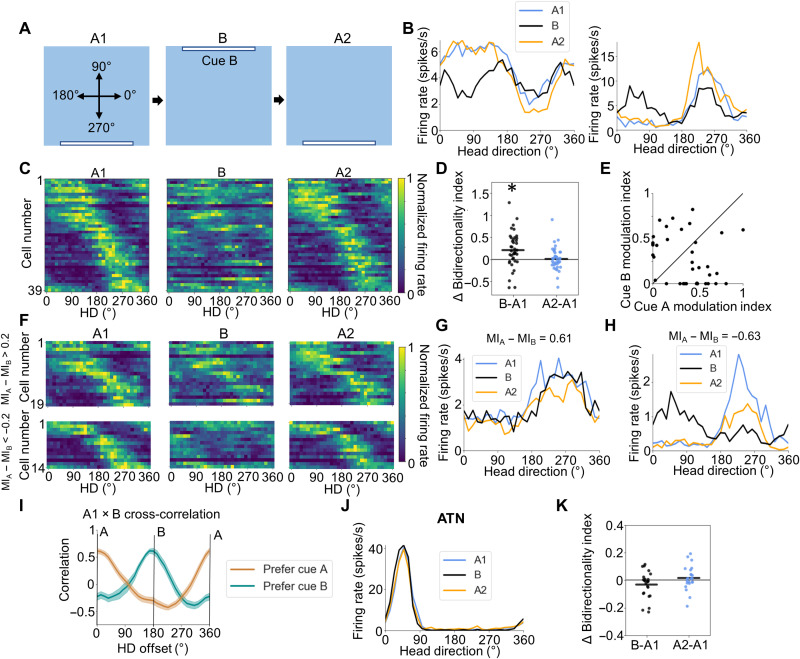
Fig. 4. B session.
(A) Experimental design for the B experiment. Top-down view of the recording arena showing the locations of visual cues across A1, B, and A2 sessions, as well as the reference frame for measuring allocentric HD. (B) Tuning curves for two example POR LM-HD cell that showed trough-locked (left) or peak-locked (right) tuning relative to both cue B and the previous location of cue A. (C) Normalized tuning curves for all POR LM-HD cells recorded in the B experiment. (D) Comparison of BI between the initial A1 session and both B and A2 sessions, showing an increase in bidirectionality during the B session. Asterisk (*) denotes statistical significance. (E) Scatter plot comparing the degree of firing rate modulation attributed to cues A and B during the B session for all recorded POR HD cells. Black line shows x = y. (F) Normalized tuning curves for LM-HD cells recorded during the B experiment that have been split according to whether their firing during the B session mostly favors cue A (MIA − MIB > 0.2), upper row or cue B (MIA − MIB < −0.2), lower row. (G) Tuning curves for an example POR LM-HD cell that remained tuned to cue A across all sessions. (H) Tuning curves for an example POR LM-HD cell that switched to mainly encoding cue B during the B session. (I) Cross-correlation between A1 and B session tuning curves, split according to the groupings in (F). Note that cells preferring cue A show a peak near 0°, while cells preferring cue B show a peak near 180° (J) Tuning curves for an example ATN HD cell that maintained its firing properties across all sessions. (K) Change in bidirectionality from session A1 to sessions B and A2 for ATN HD cells.

