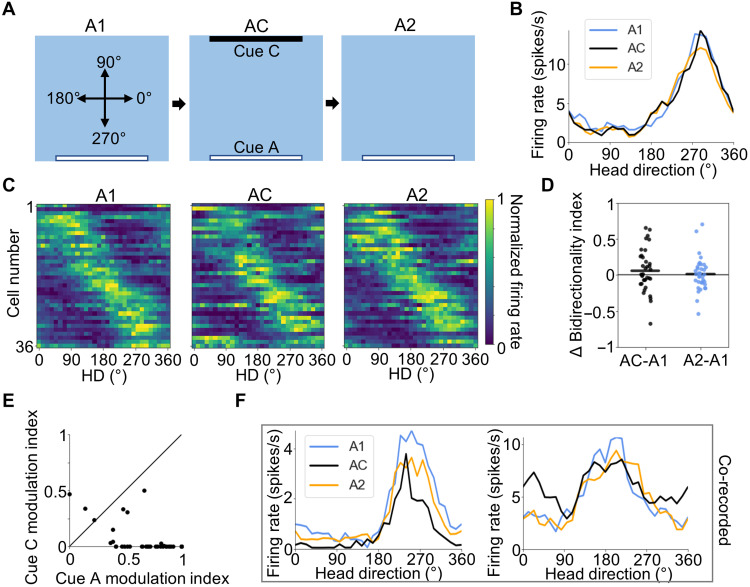
Fig. 5. AC session.
(A) Experimental design for the AC experiment. Top-down view of the recording arena showing the locations of visual cues across A1, AC, and A2 sessions, as well as the reference frame for measuring allocentric HD. (B) Tuning curves for an example POR LM-HD cell recorded across A1, AC, and A2 sessions that did not respond to the addition of cue C. (C) Normalized tuning curves for all POR LM-HD cells recorded in the AC experiment. (D) Comparison of BI between the initial A1 session and both AC and A2 sessions, showing no change in bidirectionality in either session. (E) Scatter plot comparing the degree of firing rate modulation attributed to cues A and C during the AC session for all recorded POR LM-HD cells. Black line shows x = y. Note that cells largely showed stronger tuning to cue A than cue C. (F) Tuning curves for two co-recorded POR LM-HD cells, one of which did not respond to the addition of cue C (left) while the other became bidirectional (right); note the increase in firing rate around 30°.

