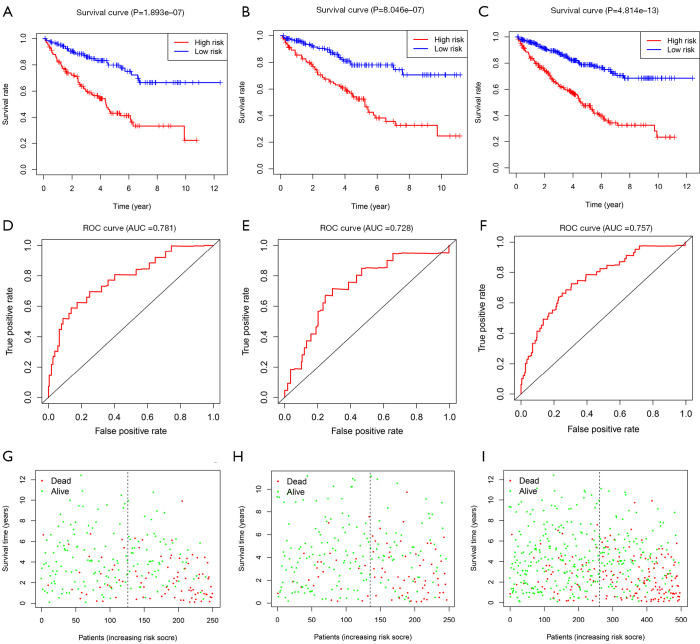
Figure 3.
We use graphics to verify five miRNAs. We divided patients into high-risk and low-risk groups according to the median risk value of each type of miRNA. The risk value survival curve of the training group (A), test group (B), and the whole group (C). The ROC curve of training group (D), test group (E,) and the whole group (F); and the survival status of the training group (G), test group (H), whole group (I) high-risk, and low-risk patients.

