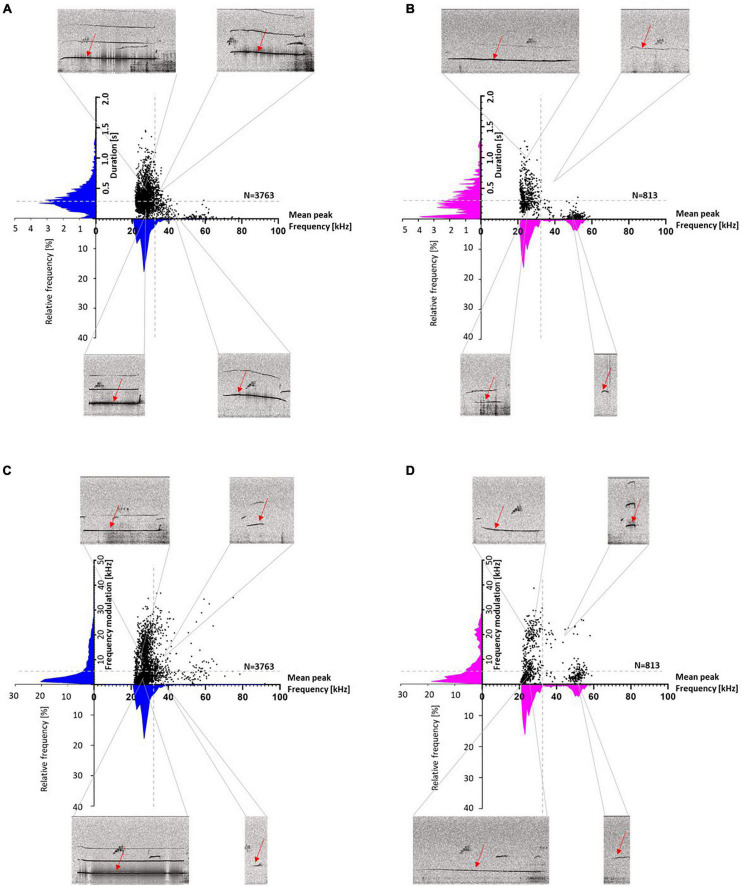
FIGURE 6.
Wistar (WI) (A,C) and Sprague-Dawley (SD) rats (B,D) scatter plots with histograms (blue for WI and magenta for SD rats) of duration or frequency modulation vs. mean peak frequency. Duration is divided into <> 0.3 s (A,B: horizontal gray dashed lines), frequency modulation is divided into <> 5 kHz (C,D: horizontal gray dashed lines) and mean peak frequencies are divided into <> 32 kHz (vertical gray dashed line). For each section, an exemplary call with the respective parameters is shown (red arrows).

