FIGURE 8.

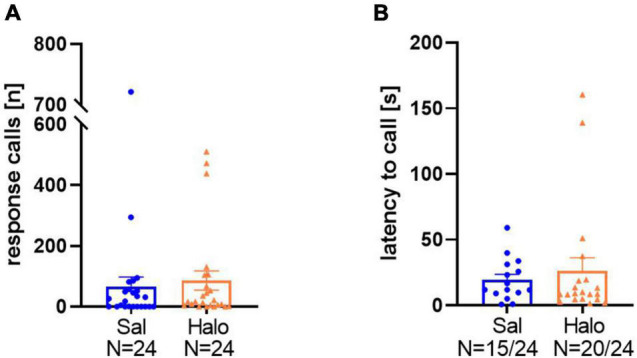
Total numbers of response calls (A) and latencies to call (B) in Sal- and Halo-treated rats. Data are presented as individual results and as means ± SEM.

Total numbers of response calls (A) and latencies to call (B) in Sal- and Halo-treated rats. Data are presented as individual results and as means ± SEM.