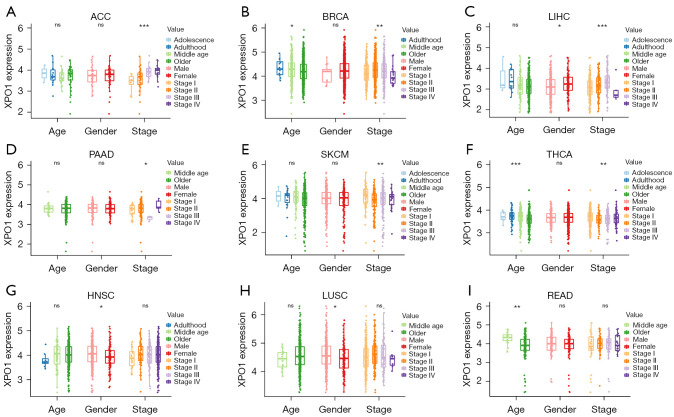
Figure 3.
Correlations of XPO1 expression with clinical characteristics. Correlations of XPO1 expression in (A) ACC, (B) BRCA, (C) LIHC, (D) PAAD, (E) SKCM, (F) THCA, (G) HNSC, (H) LUSC, and (I) READ with patient age, sex, and clinical stage (*, P<0.05; **, P<0.01; ***, P<0.001, ns: not statistically significant. The P value of age in each tumor: ACC: 0.623; BRCA: 0.029; LIHC: 0.265; PAAD: 0.961; SKCM: 0.393; THCA: 3.65e-04; HNSC: 0.284; LUSC: 0.217; READ: 0.001. The P value of gender in each tumor: ACC: 0.697; BRCA: 0.286; LIHC: 0.033; PAAD: 0.649; SKCM: 0.739; THCA: 0.952; HNSC: 0.014; LUSC: 0.026; READ: 0.79. The P value of stage in each tumor: ACC: 9.66e-04; BRCA: 0.002; LIHC: 7.71e-04; PAAD: 0.035; SKCM: 0.01; THCA: 0.001; HNSC: 0.399; LUSC: 0.192; READ: 0.906). XPO1, Exportin 1; ACC, adrenocortical carcinoma; BRCA, infiltrating ductal carcinoma; LIHC, liver hepatocellular carcinoma; PAAD, pancreatic adenocarcinoma; SKCM, skin cutaneous melanoma; THCA, thyroid carcinoma; HNSC, head and neck squamous cell carcinoma; LUSC, lung squamous cell carcinoma; READ, rectum adenocarcinoma.

