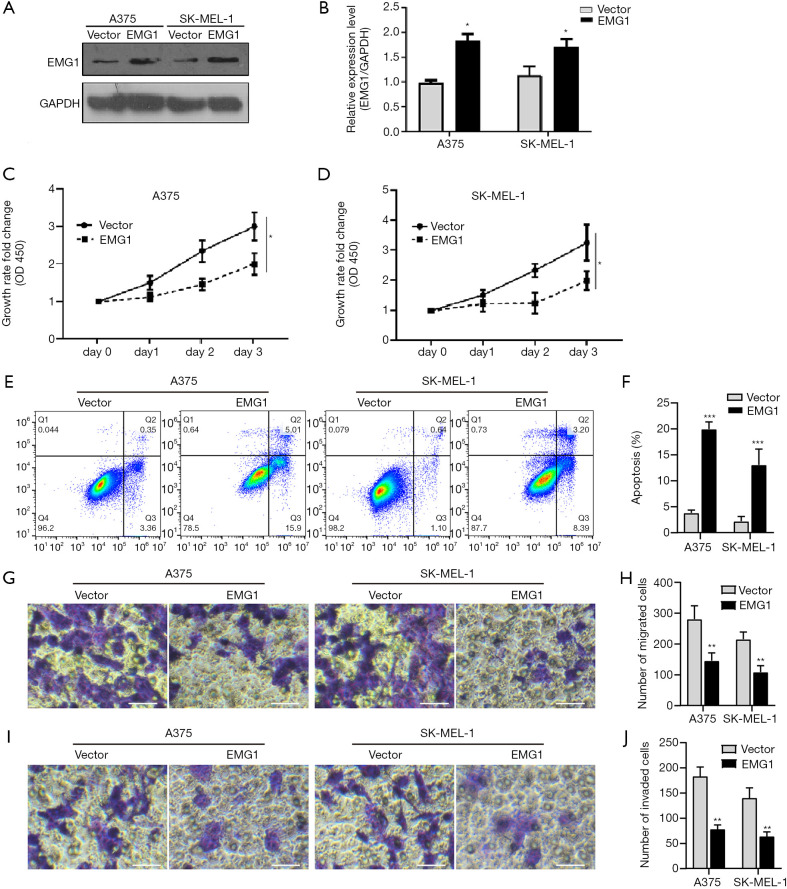
Figure 2.
EMG1 inhibits progression in melanoma. (A) EMG1 is overexpressed in A375 and SK-MEL-1 cells. (B) Quantification of the western blotting results in (A). (C) Growth rate of EMG1-overexpressing A375 cells. (D) Growth rate of EMG1-overexpressing SK-MEL-1 cells. (E) Measurement of apoptosis in the two cell lines after overexpression of EMG1. (F) Quantification of the flow cytometry results. (G) Migration of the two cell lines. (H) Quantification of the migration assay results. (I) Invasion of the two cell lines. (J) Quantification of the invasion assay results. *P<0.05, **P<0.01 and ***P<0.001 versus Vector. Scale bar: 20 µm.

