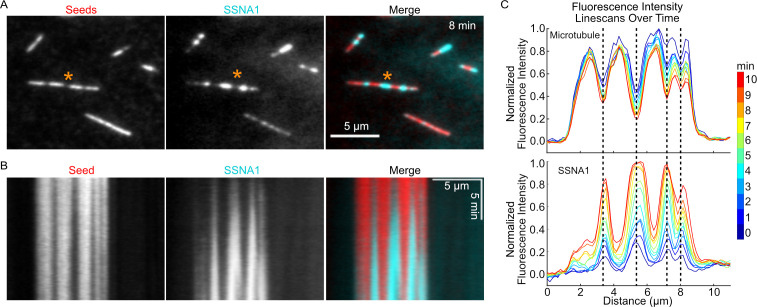
Figure 5. SSNA1 detects microtubule lattice damage.
(A) Representative images of GMPCPP-stabilized microtubules (red) that were pre-incubated for 5 min with 100 nM spastin and 1 mM ATP and then subsequently incubated with 5 µM 647-SSNA1 (cyan). The images shown are from 8 min after SSNA1 addition. The orange asterisks indicate the microtubule used for kymograph and linescan analysis. (B) Kymographs showing SSNA1 localization to sites of spastin-induced microtubule damage. (C) Corresponding linescan analysis of the microtubule and SSNA1 intensities every minute from 0 min to 10 min after the introduction of SSNA1.
Figure 5—figure supplement 1. SSNA1 detects sites of microtubule lattice damage on GMPCPP-stabilized and Taxol-stabilized microtubules.
Figure 5—figure supplement 2. Spastin protein purification.


