. 2021 Dec 15;10:e60360. doi: 10.7554/eLife.60360

Figure 6. Myr-CN27 erases long-term potentiation (LTP) in acute slices.

(A) Cartoon diagram of two pathway experiment. To record the response from two independent pathways, two bipolar stimulating electrodes were positioned to either side of the recorded cell with a distance of around 100 μm. Stimuli were applied alternately every 20 s. (B) A sample experiment showing that myr-CN27 inhibited the LTP pathway more strongly than the control pathway. (C) Left, summary data showing that myr-CN27 reduced the control pathway (black circles) 50%, while completely reversing LTP (red circles) (the difference between control and LTP pathway at 60 min: n = 11, p > 0.05, two-tailed Wilcoxon Signed Rank Test). Responses are mean ± standard error of the mean (SEM). Right, sample traces showing the effect of myr-CN27 on AMPA EPSCs in control and LTP pathway. LTP is induced by 2 Hz stimulation for 90 s, while holding the cell at 0 mV.

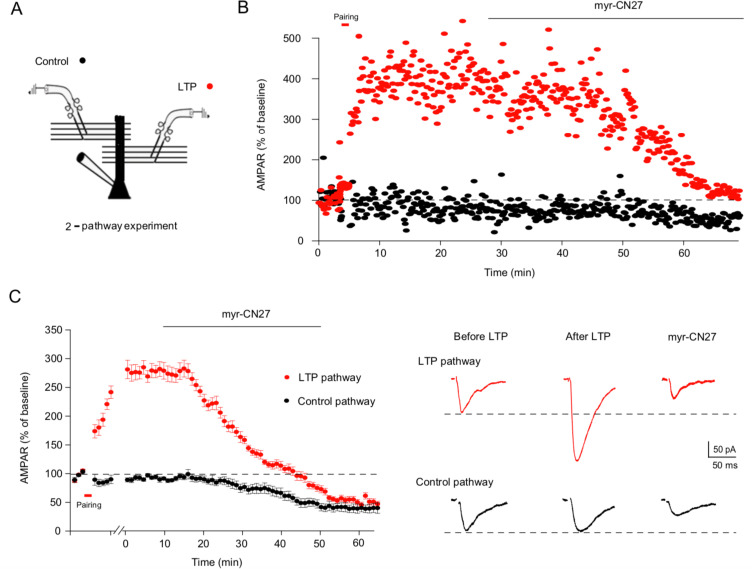
Figure 6—source data 1. Myr-CN27 erases long-term potentiation (LTP) in acute slices.
In this dataset, the results of the effects of myr-CN27 on LTP and control pathways are included.

Figure 6.

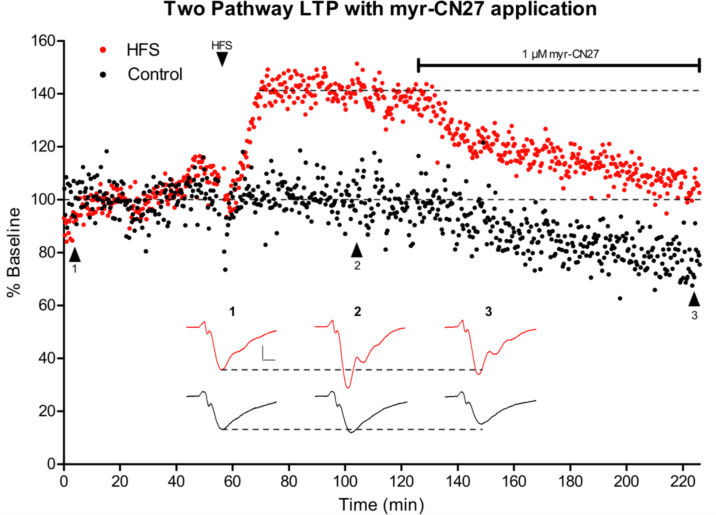
Figure 6—figure supplement 1. Reversal of long-term potentiation (LTP) and reduction of synaptic transmission with application of 1 μM myr-CN27.

Figure 6—figure supplement 1.

After a 55-min stable baseline in both pathways (Control = black, LTP = red, both n = 1), a train of 100 Hz for 1-s stimuli was applied four times with an interval of 20 s. Following the stimulus, the LTP pathway exhibited a rapid increase in fEPSP slope that plateaued at ~140% of baseline. The control pathway did not exhibit this increase. After a stable baseline was achieved for the LTP pathway, 1 μM myr-CN27 was applied. Following application, both pathways exhibited a decrease in fEPSP slope with the LTP pathway exhibiting a greater decrease. Example traces for both pathways are displayed below the graph and taken at the indicated timepoints (1–3). Traces are colored according to the pathway they correspond to. The scale bars are vertical 0.1 mV and 5 ms horizontal. Recording done in WT acute slices from P15–28 mice.