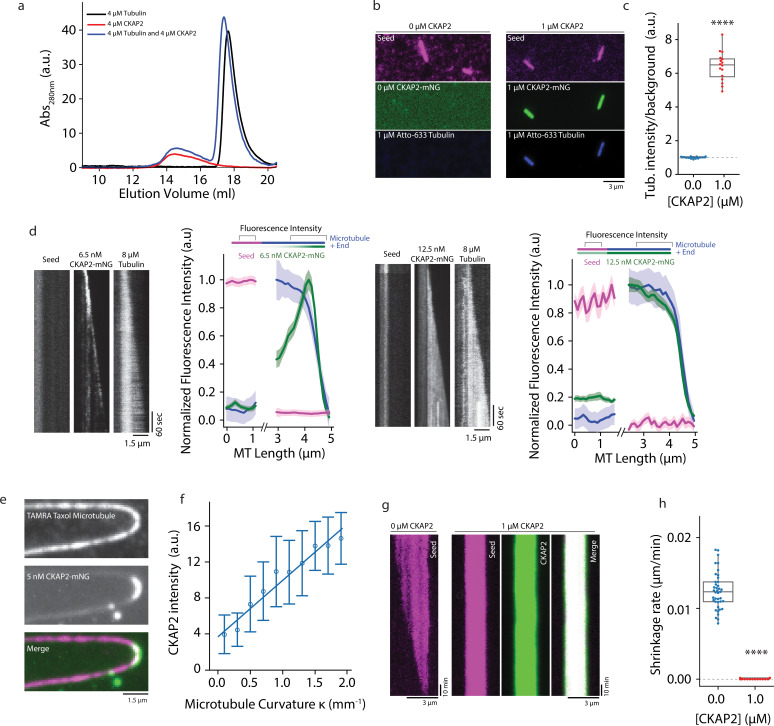
Figure 5. Cytoskeleton-Associated Protein 2 (CKAP2) recruits tubulin, recognizes lattice curvature, but does not catalyze microtubule depolymerization.
(a) Size exclusion chromatography traces for 4 µM CKAP2, 4 µM tubulin, and a combination of both. (b) Field of view showing 1 µM CKAP2-mNeonGreen (mNG) recruiting Atto-633 tubulin to guanosine-5′-[(α,β)-methyleno]triphosphate (GMPCPP) seeds. (c) Box plot of tubulin intensity on the GMPCPP lattice over background for control and 1 µM CKAP2-mNG (blue; n = 17 from one representative channel) and 1 µM CKAP2-mNG (red; n = 16 from one representative channel). Tukey’s test and one-way analysis of variance (ANOVA) used to compare mean values of raw data. ****p ≤ 0.0001. (d) Kymographs representative of 6.5 and 12.5 nM CKAP2-mNG on a growing microtubule seed and plus end. Plot of normalized average fluorescence intensity of CKAP2-mNG, microtubule seed, and dynamic microtubule lattice along microtubule seed and + end (6.5 nM) (n = 42 seed, 54 tip), 12.5 nM (n = 17 seed, 26 tip). Plotted as normalized background subtracted average ± standard error (SE). (e) Field of view of 5 nM CKAP2-mNG preferentially binding to curved regions of tetramethylrhodamine (TAMRA)-labelled paclitaxel-stabilized microtubules. (f) Plot of CKAP2-mNG intensity versus curvature (κ) measured using Kappa (Mary and Brouhard, 2019) (n = 73 from two replicates. Plotted as binned mean ± standard deviation [SD]). (g) GMPCPP seed depolymerization kymographs representative of n = 41 (control) and n = 16 (1 µM CKAP2-mNG). (h) Box plot displaying the shrinkage rate of GMPCPP microtubule seeds for control (blue; n = 41 from one representative channel) and in the presence of 1 µM CKAP2-mNG (red; n = 16 from one representative channel). Tukey’s test and one-way ANOVA used to compare mean values of raw data. ****p ≤ 0.0001.


