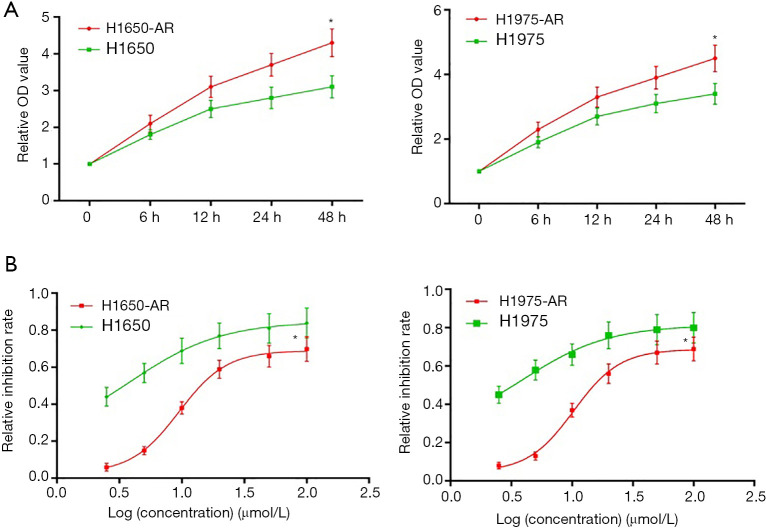
Figure 1.
Establishment and identification of afatinib-resistant H1975 and H1650 cell lines. (A) H1975 and H1650 cells were administrated with increasing concentration of afatinib (0.2 to 10 µmol/L) in complete medium. Following exposure to increasing concentration of afatinib for at least 6 months, live cells that developed acquired resistance to less than 5.0 µmol/L of afatinib were collected. H1650, H1650-AR, H1975 and H1975-AR cells were treated with 5.0 µmol/L of afatinib for indicated times, and then the optical density (OD) value of cell proliferation was determined by MTT assay. (B) H1650, H1650-AR, H1975 and H1975-AR cells were administrated with afatinib (2.5, 5.0, 10, 20, 50, 100 µmol/L) for 48 h, and then cell proliferation inhibition assay was carried out. Data was represented as mean ± SD. Each experiment was assayed in triplicate independently. *P<0.01, vs. control.

